

It is second shift, and final assembly has a seat-bolt station throwing intermittent NOKs. The repair loop is filling up. Quality wants to know whether any of the rundowns that passed this week looked like the ones that failed, and the only person who can pull curves off the nutrunner controller is on days. Meanwhile the body shop is chasing spatter on one framing station, the tip dress counter on that gun was set by feel three model years ago, and the paint shop has a run of craters on hoods that started sometime after the booth air house was serviced. Three shops, three PLC brands, three sets of screens, and nobody can lay the weld data, the booth data, and the torque data for one VIN side by side without a week of spreadsheet work.
That gap is expensive. Siemens’ 2024 survey of downtime put the cost of a lost hour at a large automotive plant at $2.3 million, more than $600 a second, double its 2019 figure [1]. Warranty is the slower bill: automakers worldwide paid $57.9 billion in warranty claims in 2024, about 2.2% of vehicle sales revenue [2]. Some of that traces straight back to the line. In 2019 FCA recalled 253 Jeep Cherokees because a front passenger seat fastener might not have been torqued to spec; the root cause named an untrained operator, a tool tether that allowed out-of-station work, and a fastener tool with limited torque documentation [5]. In 2023 Mack recalled 395 medium and heavy-duty vehicles because the tool tightening steering gear fasteners was improperly calibrated [6]. Both trace back to the tightening tool and the records kept about it.
This paper is for the controls engineers, manufacturing engineers, and maintenance leads who own those controllers. It lays out what to connect in body, paint, and final, how to move that data without opening the plant network, how to run your own quality and torque models on the same edge hardware that carries the SCADA, and where these projects usually go wrong. Most of the first steps need no new platform at all.
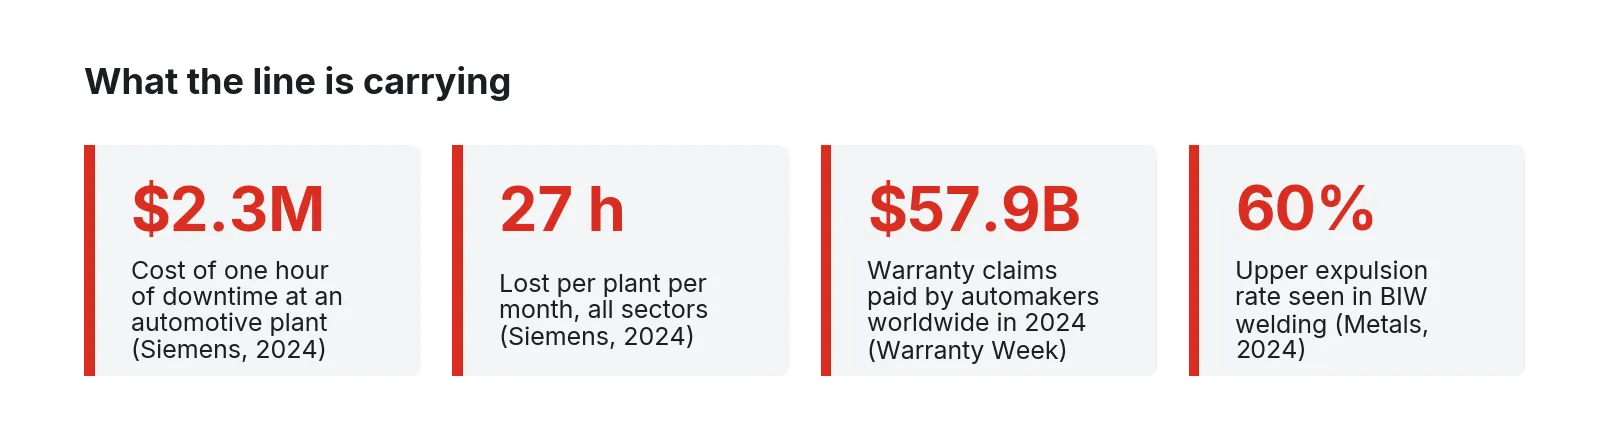
Figure 1. Downtime, warranty, and weld-quality figures from the Siemens True Cost of Downtime 2024 report [1], the Warranty Week worldwide auto warranty report [2], and Stavropoulos and Sabatakakis in Metals, 2024 [4].
A self-check for your plant
Try to answer these about your own site today, without asking anyone to run a report.
- For a VIN that left the plant last Tuesday, can you pull the torque and angle result for every safety-critical joint, the weld schedule results for its body, and the booth temperature and humidity when it was painted, within an hour?
- Do you know the tip dress interval on each weld gun, and was it set from electrode wear data or from experience?
- When a nutrunner passes a rundown as OK, does anyone look at the shape of the curve, or only at the final torque and angle window?
- How many PLC and controller brands are in your body, paint, and final shops, and how many different engineering tools does it take to read them all?
- What did your last hour of unplanned downtime in each shop cost, and who in the building knows that number?
- If a ransomware event hit the plant’s business network tomorrow, which production cells would stop because they depend on it?
- Which error-proofing devices are allowed to be bypassed, who approved it, and where is that recorded?
If more than two of these took a phone call to answer, the plant has the data and lacks the connection.
What actually needs to be connected
Every shop already measures most of what matters. The work is getting those signals out of the controllers that own them, tagging them with the VIN or body ID, and keeping them long enough to answer questions.
Body-in-white
A car body carries roughly 3,000 spot welds for a small passenger car and up to 9,500 for a van [3]. Each weld controller knows the current, voltage, weld time, and force it delivered, and many record electrode displacement. Mathiszik and colleagues showed that electrode length change is visible in the ordinary process data the controller already records, which makes it usable as an inline wear signal without extra sensors [3]. Their survey of practice found that tip dress timing is still mostly set from experience instead of process data [3].
Expulsion is the other body shop signal worth chasing. A 2024 review of spot weld quality assurance in Metals reported expulsion occurrence of up to 60% in body-in-white production, because lines run close to the expulsion limit to get larger nuggets, and expelled metal has to be cleaned off before the body goes to paint [4]. The same review notes that most weld quality checks remain offline or destructive, run on samples, and that welds made with identical parameters can still differ because of electrode wear, coating, and fit-up [4].
Paint
The paint shop is the largest energy user in vehicle manufacturing, about 36% by one review [12], and its quality depends on conditions the booth and oven PLCs already control: booth air temperature and humidity, downdraft velocity, bell speed, shaping air, high voltage, paint flow, and oven zone temperatures and dwell. The same review describes an e-coat around 20 µm thick, primer cured at about 140 °C for 30 minutes, and topcoat at about 125 °C for 30 to 40 minutes, with booths held near room temperature and air velocity below 1 m/s [12]. Foreign material is the most common automotive coating defect according to the American Coatings Association’s CoatingsTech, followed by surface-tension defects such as craters, gravity defects such as sags, and solvent popping [13]. Most of those have a cause somewhere in the air house, the oven, or the applicator, and the PLCs record it every second.
Final assembly
DC nutrunner controllers record torque, angle, and status for every rundown, and most can export the full torque-angle curve. On controllers that speak Atlas Copco’s Open Protocol, the “last tightening result” message carries the VIN, torque and angle status, a tightening ID, a timestamp, and the tool serial number [10]. Angle monitoring catches what final torque alone can miss: cross-threaded or damaged fasteners, missing washers, cables trapped under a screw head, and re-hits [9].
VDI/VDE 2862 sets the expectations by joint category. Category A joints are those whose failure can endanger life and limb; Category B joints are those whose failure stops the vehicle; Category C covers the rest [8]. For Category A, the guideline calls for a control variable and a monitoring variable, typically torque and angle, with full tightening data documented and tied to the component [7][8]. Atlas Copco’s guidance on the standard makes the practical point: when results are stored per component, a plant can find the first screw that went wrong and size the batch that needs rework [7].
Where each signal lives
| Signal | Source | Why it matters |
|---|---|---|
| Weld current, voltage, time, force | Weld controller | Nugget quality and expulsion, per weld and per gun |
| Electrode displacement, weld count since dress | Weld controller, robot controller | Measured wear for tip dress timing and cap change |
| Spatter and expulsion flags | Weld controller | Cleaning load before paint; early sign of fit-up or cap trouble |
| Clamp and station states, cycle time | Body shop PLCs | Fit-up problems and constraint stations |
| Booth temperature, humidity, downdraft | Air house and booth PLCs | Dirt, solvent pop, orange peel, sags |
| Bell speed, shaping air, voltage, flow | Applicator controls | Film build and transfer efficiency |
| Oven zone temperatures, conveyor speed | Oven PLC | Cure window per body |
| Torque, angle, status, full curve | Nutrunner controllers | Joint quality per VIN, Category A documentation |
| Error-proofing device state and bypass | Station PLCs | Proof the device worked at shift start; record of bypasses |
| Andon calls, line stops, takt | Line PLC, andon system | Minutes lost and where |
| VIN by position | Build schedule, AVI readers | The key that ties everything above to one vehicle |
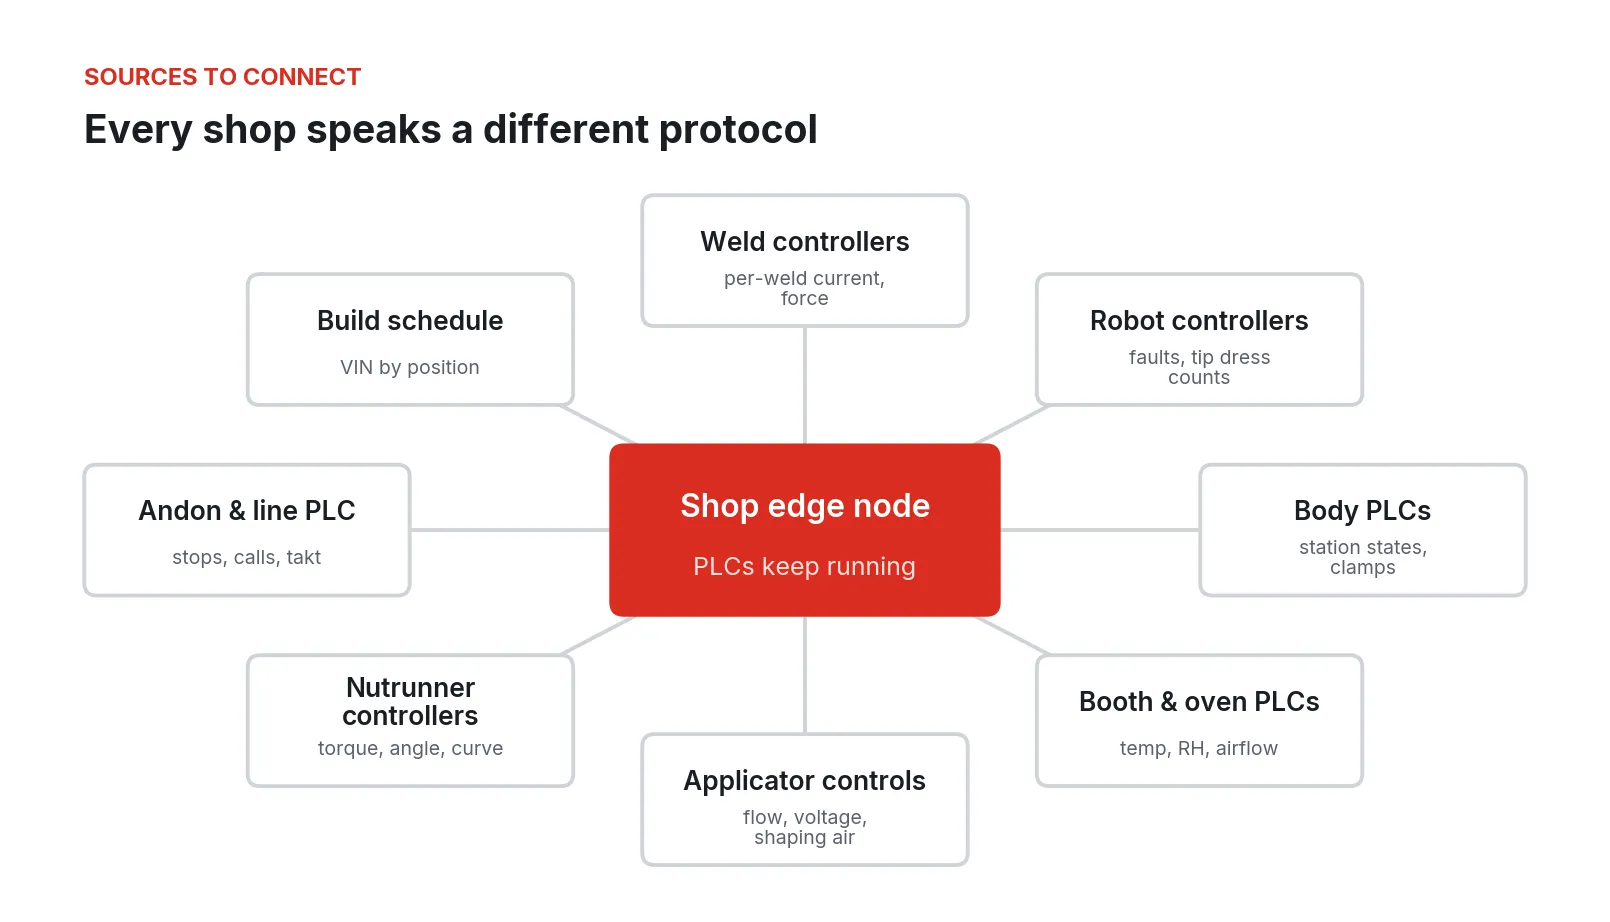
Figure 2. The controllers and systems that hold the signals above, connected through one edge node per shop while each PLC keeps running its existing program.
A reference architecture
The architecture that holds up in an automotive plant has five layers, and the rule that keeps it safe is simple: data flows up, and control stays with the cell.
- Equipment. Weld controllers, robots, booth and oven PLCs, applicator controls, nutrunner controllers, and the line PLC, all running their current programs.
- A shop edge node. One industrial PC per shop or per zone, on the cell side of the plant network, reading tags from each controller, timestamping and tagging every record with VIN or body ID, and buffering locally when the upstream network is down.
- Applications on the node. The plant’s SCADA or HMI, a historian, and the plant’s own models: a torque curve classifier, an electrode wear model, a booth-conditions-to-defect correlation. Each runs isolated from the others so a model crash cannot take the SCADA with it.
- A console. One place to see every node, deploy and roll back applications, scope access by role, and keep an audit trail of who changed what.
- People. Maintenance gets alarms and work orders. Quality gets the per-VIN record and holds. Controls gets deployment and rollback.
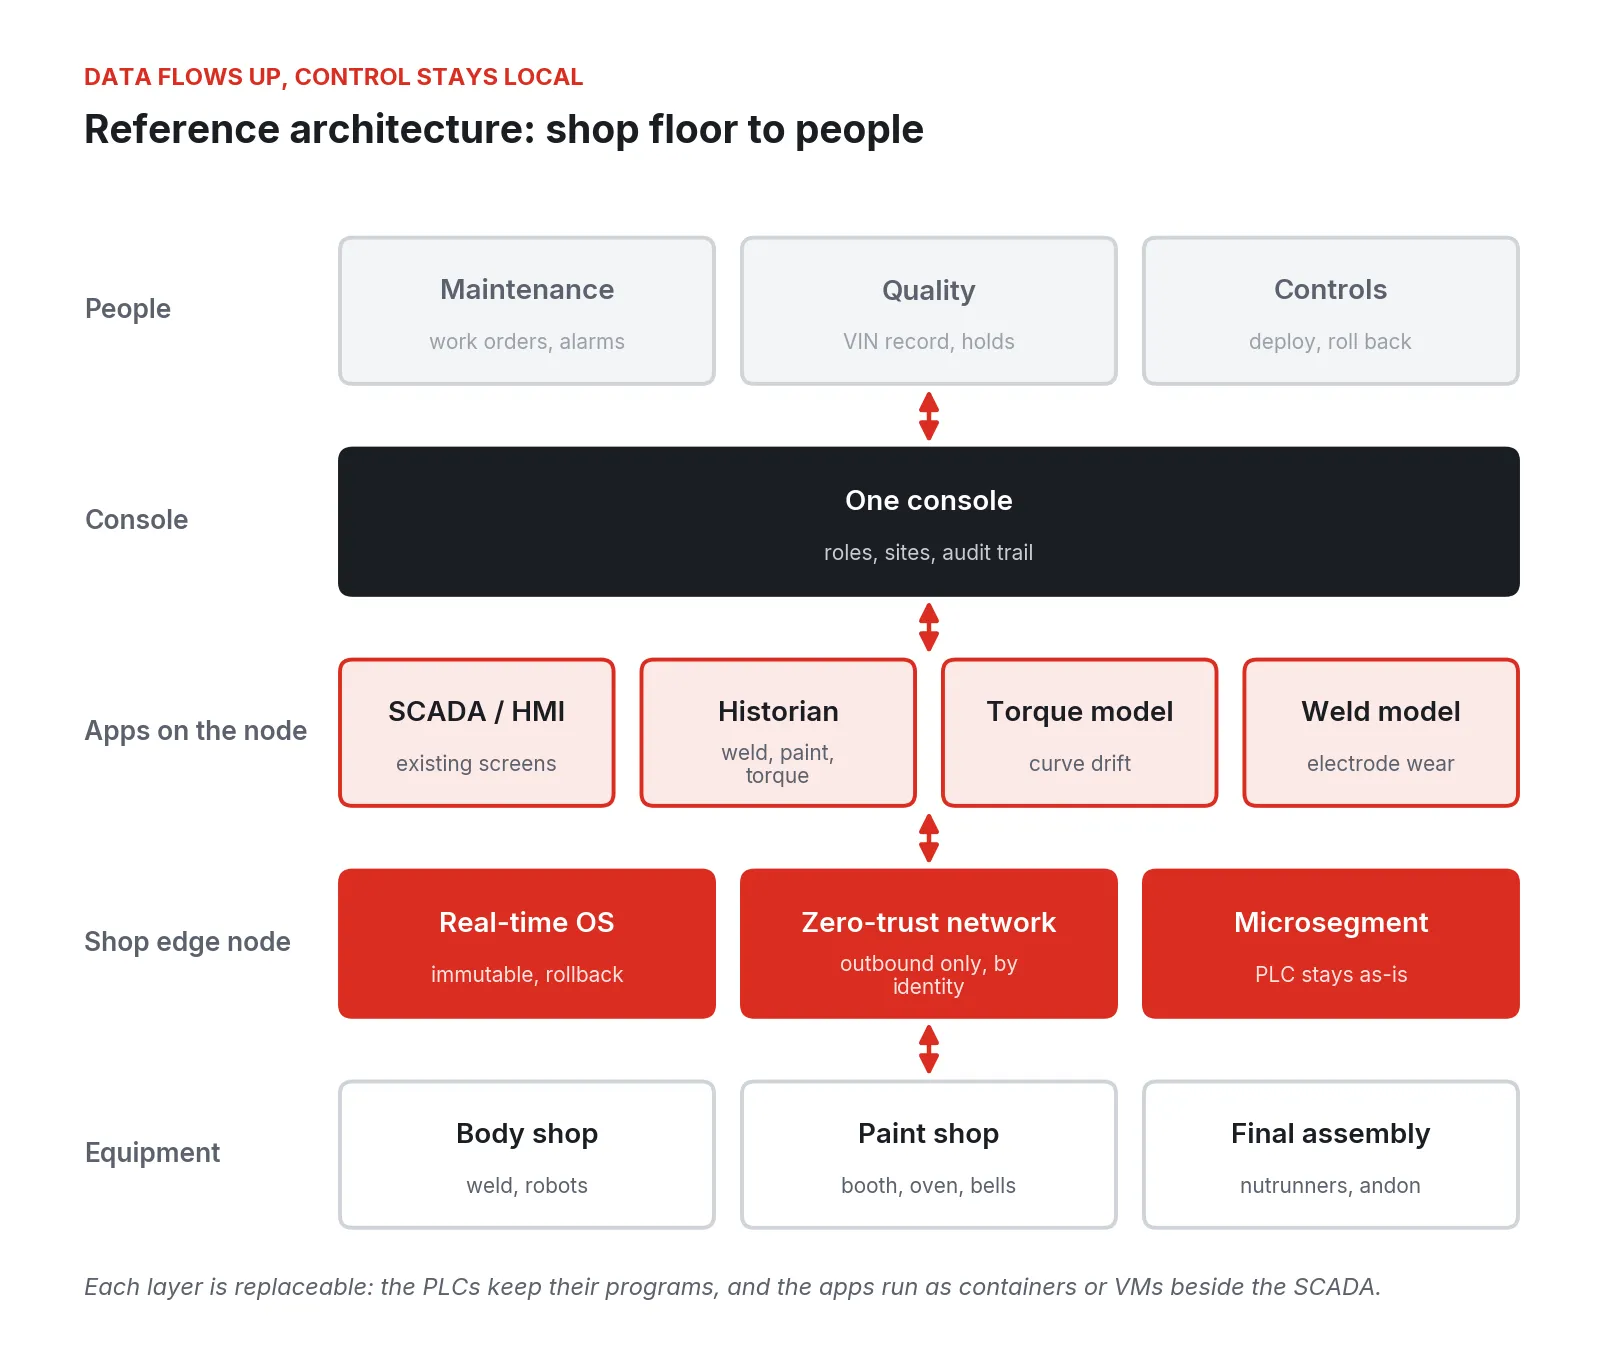
Figure 3. Reference architecture from shop-floor equipment to the people who act on the data. Control stays in the cells; data moves up through a per-shop edge node.
Running the models on the same node as the SCADA matters for two reasons. The model sees the data at line speed with no round trip to a data center, so a suspect rundown can trigger a hold before the vehicle leaves the station. And there is one stack to patch and secure, instead of a SCADA server, a separate analytics box, and a cloud gateway.
Shop by shop: cheap fixes first
Final assembly first
Final assembly is usually the fastest return, because the nutrunner controllers already hold the data and the VIN is already in the result message. Start here.
- Pick the station that argues most. A seat, suspension, or steering joint with a history of NOKs or repair-loop traffic is a good choice. Category A joints are the right place to start because the documentation expectation is already there [7].
- Pull the results off the controller. Many controllers will stream results over Open Protocol or a vendor equivalent. Write every result, with VIN, tightening ID, and tool serial, into a historian [10].
- Pull the curves. The final torque and angle are only two points. The curve shows the snug point, the slope through the elastic range, and the rundown angle, which is where cross-threads, missing washers, and trapped cables show up [9].
- Compare passing curves to failing ones. Before training anything, overlay a week of OK curves against the NOKs. In many joints the bad ones are visible by eye.
- Add a simple drift check. Score each new curve against the last few hundred OK curves for that joint and tool. A curve that passes the window but sits far from the population is worth a look.
- Tie it to audits. Residual torque audits with a proper audit wrench, which continues past breakaway to find where the threads start to move, give the ground truth to check the model against [11].
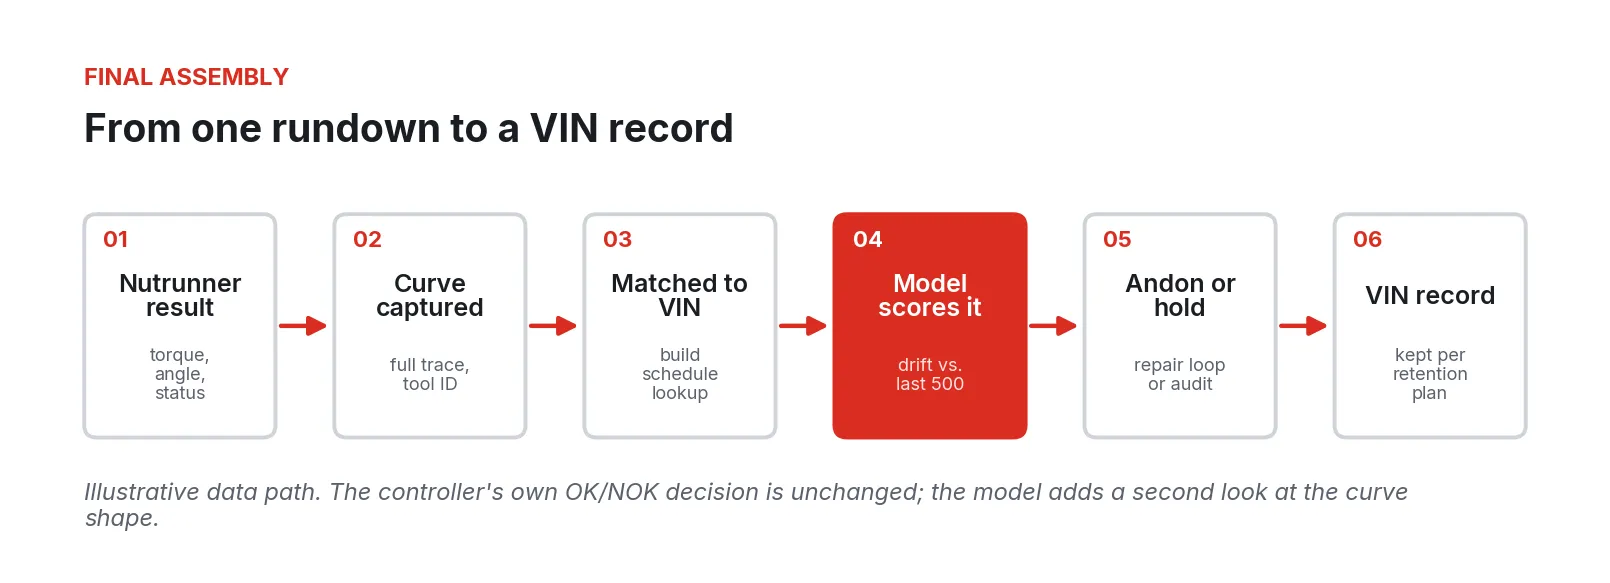
Figure 4. Illustrative data path for one rundown, from the nutrunner controller to the VIN record. The controller’s own OK/NOK decision stays in charge.
Two recall reports above cite causes that this data would have exposed: a tool with limited torque documentation, and a tool out of calibration [5][6]. A curve population that suddenly shifts after a tool swap or calibration is visible on the first shift it happens.
Body shop next
- Count welds per dress. Read the weld counter and the dress events from each gun and put them on one screen. This alone usually shows guns dressed far more or far less often than their neighbors.
- Trend electrode displacement and resistance per gun. Mathiszik and colleagues show wear is visible in the existing process data [3]. Trending it per gun turns tip dress timing into a measured decision.
- Flag expulsion by gun and station. With expulsion as common as the Metals review reports [4], knowing which guns run hottest tells the line where fit-up, caps, or schedules need attention, and tells paint which bodies need extra cleaning.
- Aim destructive tests. If teardown and ultrasonic checks are sampled anyway, point the samples at the welds the data flags.
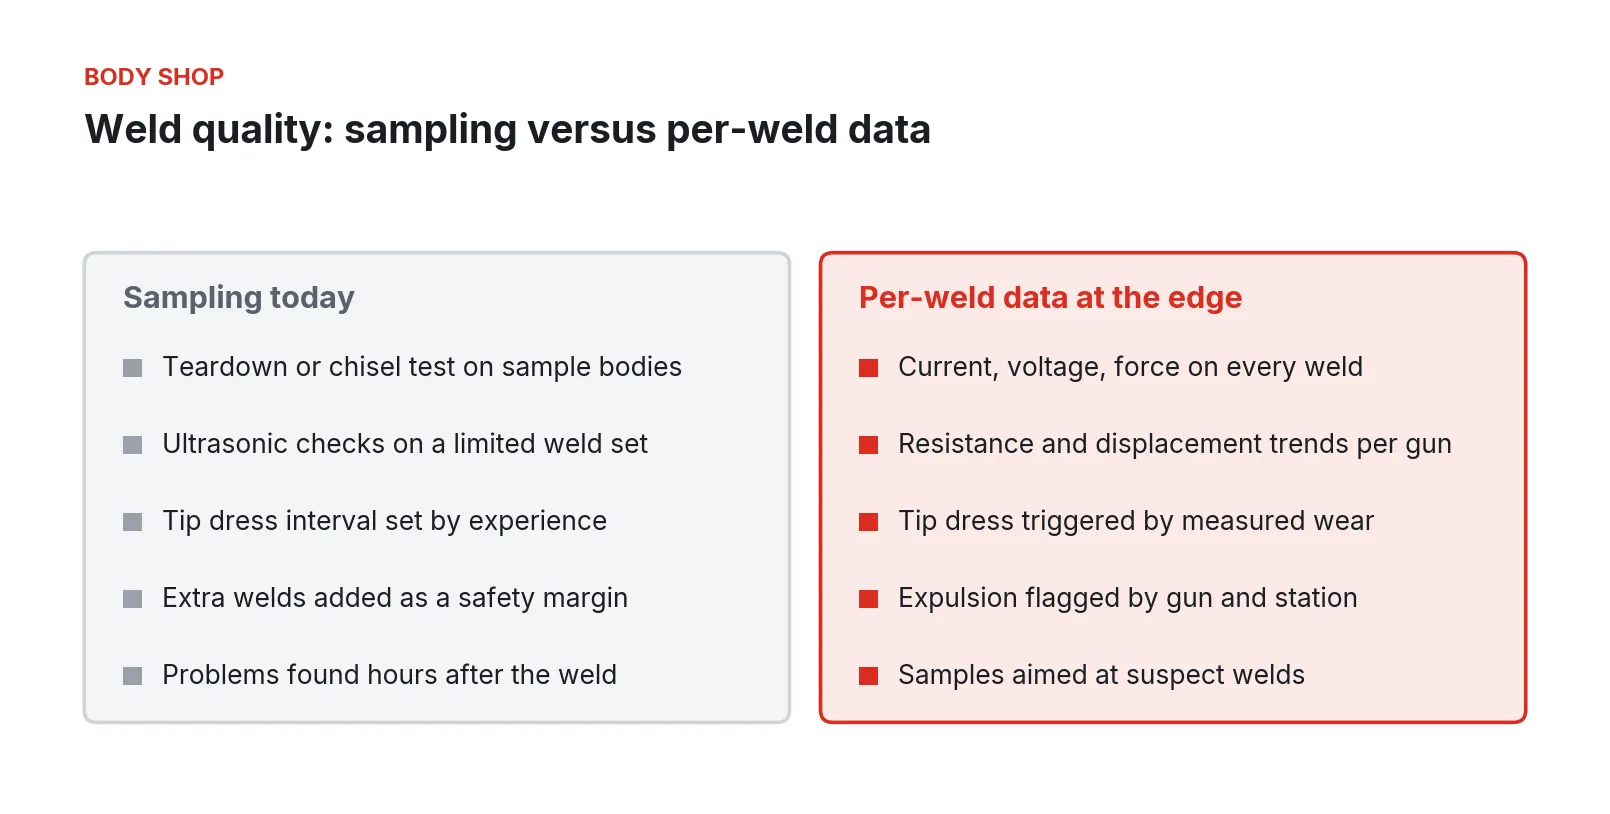
Figure 5. Weld quality practice as described in the Metals 2024 review [4] and the Processes 2021 electrode wear study [3], against what per-weld data at the edge allows.
Paint shop third
- Line up booth conditions with defect records. Booth temperature, humidity, and downdraft from the air house PLC, matched by body ID to the defect marks from the inspection deck. Dirt, craters, solvent pop, and sags each have a different signature [13].
- Record the cure window per body. Oven zone temperatures and conveyor speed give the actual time at temperature for every body, which can be checked against the coating supplier’s cure window [12].
- Watch the applicators. Bell speed, shaping air, voltage, and flow, per robot and per color, explain a large share of film build variation.
- Keep the energy data. The paint shop’s share of plant energy makes air house and oven data useful to facilities as well as quality [12].
Andon and downtime
Last, put the line PLC’s stop reasons and andon calls in the same historian. When a shop can see minutes lost by station next to the weld, paint, or torque data for the same hour, the conversation about where to spend maintenance time gets shorter. At more than $600 a second in Siemens’ estimate [1], even a few minutes a shift is worth the effort.
Where these projects go wrong
- Starting with the dashboard. Teams build a plant-wide screen before they have one station’s data clean and tied to VIN. Start with one joint or one gun and get the record right.
- Treating the VIN match as easy. Bodies get pulled, re-sequenced, and repaired. If the build schedule or AVI read is not the key for every record, the per-VIN history is wrong in exactly the cases quality cares about.
- Collecting results and skipping curves. Final torque inside the window does not prove the joint is good; angle monitoring exists because of the failure modes torque alone misses [9].
- Trusting the model over the controller. A model that second-guesses an OK rundown should trigger a look or an audit. The nutrunner controller’s validated strategy stays the authority, and the plant’s PFMEA decides what a model flag means.
- Bypassed error-proofing with no record. GM’s customer-specific requirements expect error-proofing devices to be tested to failure or simulated failure at shift start, and expect a list of which devices can be bypassed, with customer approval for the decision [14]. If the bypass state is not logged, the plant cannot show it.
- Opening the plant network to get the data out. A remote access path for a vendor’s analytics or a cloud gateway with an inbound port is a new way in. Manufacturing has been the most attacked industry in IBM’s X-Force index for four years running, with the most ransomware cases in 2024, because attackers know the tolerance for downtime is low [18].
- Assuming the supplier’s problem stays at the supplier. In March 2022 a cyberattack on one supplier, Kojima Industries, stopped 28 lines across 14 Toyota plants in Japan for a day [19]. In 2025 Jaguar Land Rover halted production for about five weeks after a cyberattack and booked £196 million of cyber-related costs in one quarter [20].
- Mixing models into the SCADA server. A model that leaks memory or pins a CPU should not be able to freeze operator screens. Isolation between applications on the edge node has to be real.
Security and compliance
The plant’s quality and cybersecurity programs own compliance. What the architecture can do is make the required controls easier to implement and to prove.
IATF 16949 and customer-specific requirements
IATF 16949 clause 8.5.2.1 expects a documented traceability plan, based on risk to customers, consumers, and employees, that lets the organization find the product affected by a quality or safety nonconformity [15]. Clause 10.2.4 covers error-proofing, and customer-specific requirements add detail: GM’s October 2025 requirements call for shift-start testing of error-proofing devices and a controlled bypass list [14]. Record retention follows customer specifications, which for GM are set in GMW15920 [14]. A per-VIN record of torque, weld, and paint data, with error-proofing states and bypass events in the same store, gives the quality team the evidence; how long it is kept, and who signs off, stays in the plant’s retention plan.
VDI/VDE 2862
For Category A joints, the guideline expects the tightening data to be complete and documented per component [7][8]. Storing every result and curve with VIN and tool serial is the direct way to meet that expectation, and it supports the machine capability testing the guideline calls for on the tools [7].
ISA/IEC 62443
ISA/IEC 62443 organizes plant security into zones, groups of assets with the same security requirements, and conduits, the controlled paths between them, with security levels set by the sophistication of the expected attacker [16]. It assigns duties to asset owners, integrators, and product suppliers, and covers the asset owner’s security program (62443-2-1), risk assessment and zone design (62443-3-2), and system security requirements (62443-3-3) [16]. NIST SP 800-82 Rev. 3 gives complementary guidance for OT, including segmentation and remote access [17].
In practice, each shop or cell becomes a zone. The edge node is the conduit: it is the only path from the cell’s controllers to anything above, it carries only the traffic the applications need, and it authenticates every connection. Remote maintenance goes through that same controlled path, with an audit trail.
A phased rollout
Figure 6. A phased rollout that starts read-only on one station and adds shops, models, and actions as each step proves out.
- Weeks 1 to 4: one station, read-only. One nutrunner station or one weld line, results and curves into a historian, matched to VIN. No writes to any controller.
- Weeks 5 to 10: the first model. A torque curve drift check or an electrode wear trend, running beside the SCADA on the same node, with its flags reviewed by a controls engineer and a quality engineer every day.
- Months 3 to 6: shop by shop. Add the other shops, one at a time, each as its own zone, all visible in one console with views scoped by role.
- Months 6 to 12: act on the data. Turn proven flags into actions the plant has agreed through its PFMEA: holds to the repair loop, tip dress triggered by measured wear, booth alarms tied to defect history.
- Ongoing: progressive migration. When an old PLC fails or goes out of support, its logic can move to a virtual PLC on the node that is already there, one cell at a time, with no plant-wide cutover.
What to do Monday
Pick the final assembly station your quality team complains about most. Find out whether its nutrunner controller can stream results and curves, and point a laptop running a free historian at it for one week, read-only. At the end of the week, overlay the OK curves against the NOKs and pull the VIN list for any OK rundown that looks like a failure. Then do the same count on one weld gun: welds per dress and expulsion flags for a week. Write down what you found, what it would have cost if those vehicles had shipped, and how long it took to get the data. That one page is the business case.
Fireball Industries is EmberNet’s master integrator. Fireball designs, builds, and supports this work in body, paint and final assembly plants: connecting mixed-brand PLCs and tool controllers, standing up the edge nodes and applications, and keeping them running alongside the plant’s controls and quality teams.
Sources
- Siemens (Senseye Predictive Maintenance). The True Cost of Downtime 2024. 2024. https://assets.new.siemens.com/siemens/assets/api/uuid:1b43afb5-2d07-47f7-9eb7-893fe7d0bc59/tcod-2024_original.pdf
- Warranty Week. Worldwide Auto Warranty Report. October 30, 2025. https://www.warrantyweek.com/archive/ww20251030.html
- Mathiszik, C., Köberlin, D., Heilmann, S., Zschetzsche, J., Füssel, U. General Approach for Inline Electrode Wear Monitoring at Resistance Spot Welding. Processes 9(4), 685. 2021. https://www.mdpi.com/2227-9717/9/4/685
- Stavropoulos, P., Sabatakakis, K. Quality Assurance in Resistance Spot Welding: State of Practice, State of the Art, and Prospects. Metals 14(2), 185. February 2024. https://www.mdpi.com/2075-4701/14/2/185
- National Highway Traffic Safety Administration. Part 573 Safety Recall Report 19V-248 (FCA US LLC, 2019 Jeep Cherokee front passenger seat fastener). March 2019. https://static.nhtsa.gov/odi/rcl/2019/RCLRPT-19V248-3650.PDF
- National Highway Traffic Safety Administration. Part 573 Safety Recall Report 23V-605 (Mack Trucks, steering gear fasteners). August 30, 2023. https://static.nhtsa.gov/odi/rcl/2023/RCLRPT-23V605-8334.PDF
- Atlas Copco (vendor). Minimum requirements for application of VDI/VDE 2862 Part 2, whitepaper. June 2023. https://www.atlascopco.com/content/dam/atlas-copco/local-countries/germany/documents-industrial-technique/Atlas%20Copco%20-%20Whitepaper%20about%20VDIVDE%202862%20Part%202_EN.pdf
- DEPRAG (vendor). VDI/VDE 2862: Efficient implementation of safe screwdriving processes. February 27, 2025. https://www.deprag.com/en/article/vdi-vde-2862-efficient-and-safe-screwdriving-processes-guide.html
- Atlas Copco (vendor). Smarter Assembly with Torque and Angle-Controlled Electric Screwdrivers. Undated. https://www.atlascopco.com/en-us/itba/expert-hub/articles/smarter-assembly-with-torque-and-angle-controlled-electric-screwdrivers
- DeviceWise (vendor documentation). MID0061 Rev.3 Last Tightening Result event variables (Atlas Copco Open Protocol). Undated. https://docs.devicewise.com/Content/Products/GatewayDevelopersGuide/Devices/DeviceTypes/AtlasCopco/MID0061-Rev.3-Last-Tightening-Result-event-variables.htm
- Archer, D. Fastening Threads: Torque Audits Are a Good Way to Check Joints. Assembly Magazine. August 28, 2008. https://www.assemblymag.com/articles/85734-fastening-threads-torque-audits-are-a-good-way-to-check-joints
- AIP Publishing. Review of coating and curing processes: Evaluation in automotive industry. Physics of Fluids 34(10), 101301. 2022. https://pubs.aip.org/aip/pof/article/34/10/101301/2846660/Review-of-coating-and-curing-processes-Evaluation
- Schoff, C. K. Automotive Coatings: Application Defects. CoatingsTech, American Coatings Association. April 2016. https://www.paint.org/wp-content/uploads/2021/09/Automotive-Coatings-Application-Defects_Apr-2016.pdf
- IATF Global Oversight / General Motors. IATF 16949 GM Customer Specific Requirements. October 2025. https://www.iatfglobaloversight.org/wp/wp-content/uploads/2025/10/IATF-16949-GM-Customer-Specific-Requirements-October-2025.pdf
- 16949 Store. IATF 16949 Requirements: Identification and Traceability (8.5.2). Undated. https://16949store.com/iatf-16949-requirements/section-08-quality-management-system-operations/identification-and-traceability/
- Costa, F. S. A Practical Approach to Adopting the IEC 62443 Standards. ISA Global Cybersecurity Alliance / Automation.com. August 31, 2021. https://www.automation.com/article/a-practical-approach-to-adopting-the-iec-62443-standards
- Stouffer, K., et al. NIST SP 800-82 Rev. 3, Guide to Operational Technology (OT) Security. National Institute of Standards and Technology. September 2023. https://csrc.nist.gov/pubs/sp/800/82/r3/final
- IBM. 2025 IBM X-Force Threat Index (press release). April 17, 2025. https://www.prnewswire.com/news-releases/2025-ibm-x-force-threat-index-large-scale-credential-theft-escalates-threat-actors-pivot-to-stealthier-tactics-302430850.html
- Arntz, P. Toyota’s just in time manufacturing faced with disruptive cyberattack. Malwarebytes. March 2022. https://www.malwarebytes.com/blog/news/2022/03/toyotas-just-in-time-manufacturing-faced-with-disruptive-cyberattack
- Paganini, P. Jaguar Land Rover confirms major disruption and £196M cost from September cyberattack. Security Affairs. November 17, 2025. https://securityaffairs.com/184742/security/jaguar-land-rover-confirms-major-disruption-and-196m-cost-from-september-cyberattack.html