

It is second shift on a mixed-vendor line. The AOI at the end of reflow has been flagging the same 0402 capacitors for an hour, and the operator at the review station has been passing most of them. Some are real. A few tombstones and a short under a fine-pitch QFN make it to ICT, where they cost a technician twenty minutes each. The next morning the process engineer pulls the SPI data and finds that paste volume on those pads started drifting low four hours before the first AOI call, right after a stencil wipe interval was stretched to keep up with a hot order. Every number needed to catch it was already on the line. It sat in four machines from three vendors, each with its own database, clock, and part-number format, and nobody had joined them.
That pattern is the most expensive habit in surface-mount assembly. The industry has known for decades where defects start. A 2011 study in Soldering & Surface Mount Technology summarizes the literature as attributing roughly 50 to 70 percent of soldering defects to the paste printing step, and in the authors’ own data from about 23,000 boards across 37 product models, shorts made up 70 percent of all defects [1]. Engineers at Speedline put the figure at 50 to 80 percent in their work on closed-loop printer control [2]. Yet most lines still find printing defects at AOI or ICT, after the board has collected placement time, components, and a reflow cycle.
This paper is for the process engineers, test engineers, and manufacturing engineering managers who run those lines. It covers what to measure at each machine, how to join the data by board, a reference architecture that keeps models and customer programs on the plant floor, the places these projects usually fail, and a phased plan you can start without buying anything.
Figure 1. Where SMT defects start and where they get missed. Printing share from Huang et al. [1]; AOI alarm and reviewer figures from one vendor’s white paper [5].
A self-check for your line
Answer these for one line, from data you can pull today.
- For a given board serial number, can you retrieve its SPI deposit results, the feeder and nozzle that placed each part, the reflow oven recipe and zone temperatures during its pass, and its AOI calls, in one query?
- What was your AOI false call rate last week, by part number and by inspection algorithm, and who decided the current thresholds?
- When SPI volume on a pad group trends toward the lower limit, what happens before it crosses? Does anyone see the trend, or only the reject?
- Which feeders and nozzles produced the most mispicks or vision rejects this month, and was any of them pulled before it caused a placement defect?
- Is the clock on your printer, SPI, placement machines, oven, and AOI within one second of each other?
- Where are your customers’ placement programs, stencil data, and AOI libraries stored, who can copy them, and would you know if someone did?
- When the oven vendor or the AOI vendor connects remotely, what can that session reach?
Questions 1 and 5 decide whether anything else in this paper works: every useful analysis on an SMT line depends on joining machine records by board and by time.
What needs to be measured, and why
Each machine on the line produces data that predicts or explains defects at the next one. The table lists what to collect from each, where it usually lives, and what it tells you.
| Machine | Signals to collect | Typical source | Why it matters |
|---|---|---|---|
| Stencil printer (DEK, MPM, ASM, Ekra) | Squeegee pressure and speed, separation speed, print gap, wipe count and interval, paste age on stencil, board ID | Machine log, CFX where supported | Settings and wipe history explain most volume and bridging drift |
| 3D SPI (Koh Young, CyberOptics, TRI, Saki) | Volume, height, area, and X/Y offset per deposit, bridging, shape flags | SPI database or CFX | The leading indicator for shorts, opens, and insufficient joints |
| Placement (Fuji, Panasonic, ASM Siplace, Yamaha, Juki) | Pick and vision reject counts per feeder and nozzle, placement offsets, feeder slot and reel ID, component lot | Machine statistics, traceability export, CFX | Nozzle and feeder wear show up as rejects before they show up as defects |
| Reflow oven (Heller, BTU, Rehm, Vitronics Soltec) | Zone setpoints and actuals, conveyor speed, O2 ppm where nitrogen is used, board-in and board-out events | Oven controller, profiler files | Ties each board to the thermal conditions it actually saw |
| AOI (Koh Young, Omron, Mirtec, Viscom) | Call per component and per joint, algorithm, operator verdict, image reference | AOI review station database | Separates real defects from false calls and closes the loop to SPI and placement |
| ICT and functional test | Pass/fail per net and test step, repair codes | Tester logs, MES | Measures escapes and confirms what AOI missed |
Three of these deserve more detail.
Solder paste inspection is the leading indicator
A 3D SPI measures volume, area, height, and positional offset for every deposit, along with bridging and shape deformity [21]. That is the earliest point on the line where a defect can be predicted for a specific pad on a specific board. One research group showed that a support vector regression model, retrained on a short window of recent boards plus initial design-of-experiments data, predicted average deposit volume with an R² of 92 percent and its standard deviation with 81 percent [4]. The point for a plant is narrower than the model: deposit volume moves in patterns tied to printer state (wipe interval, paste age, squeegee wear), and those patterns can be watched before parts cross a limit.
Huang and colleagues also showed why SPI limits deserve an engineering decision. Using assumed costs of $1 for a false alarm and $2 for an escaped short, they derived an optimal upper volume limit for 0.4 mm pitch parts by minimizing total cost [1]. Your costs will differ. The method applies: set SPI limits from what a false reject and an escape each cost you, and revisit them when the product mix changes. The cost of a missed printing defect also grows at every step it travels.
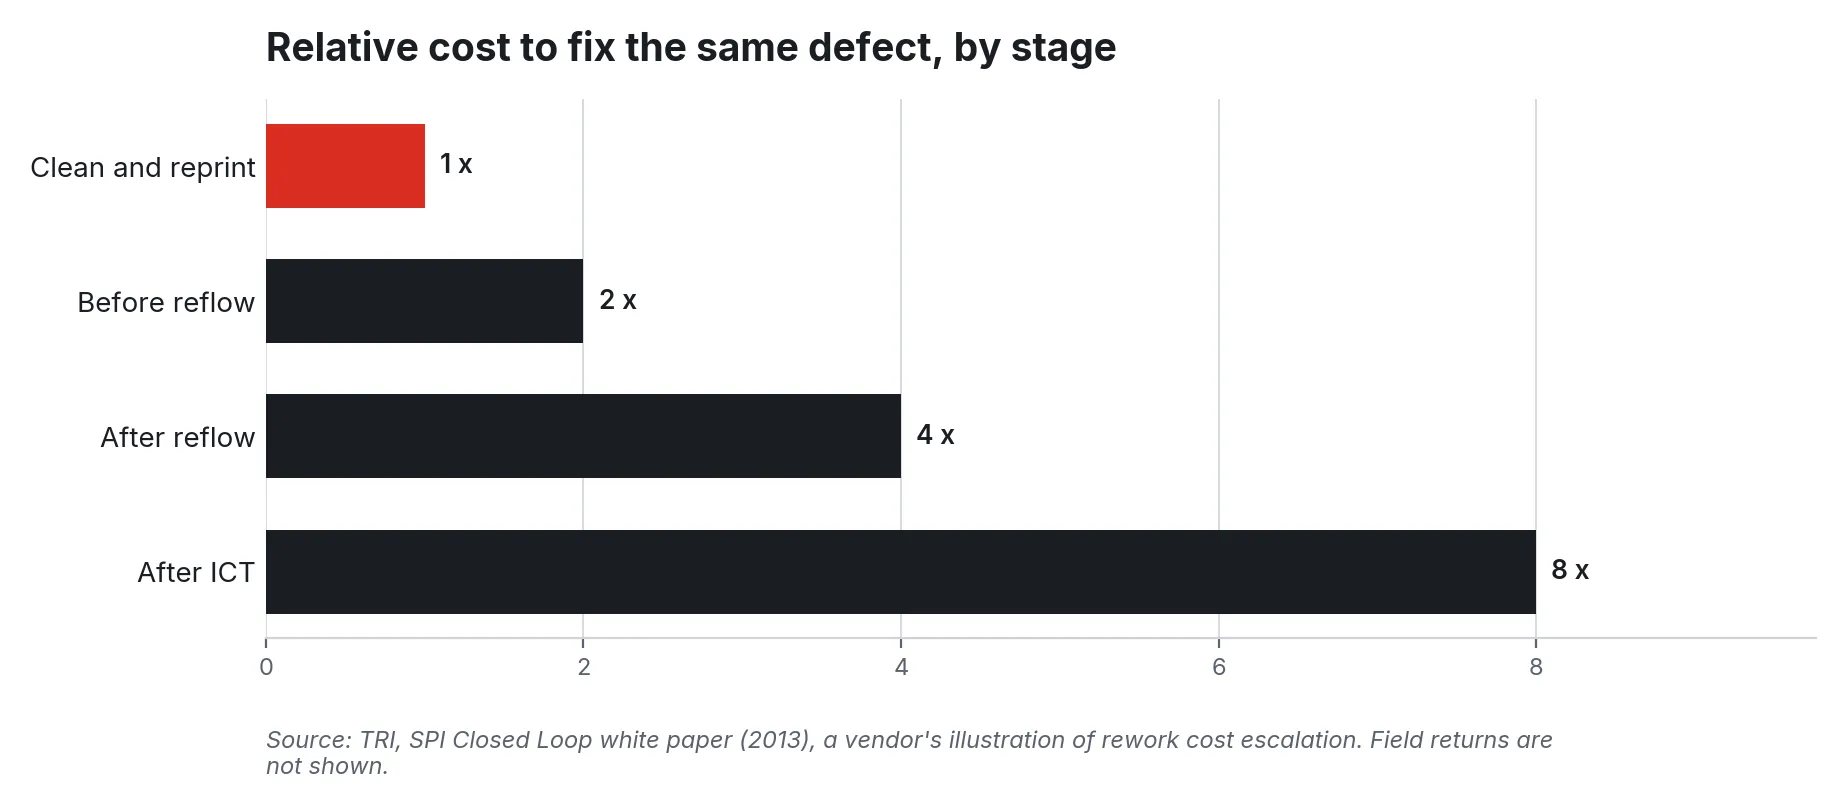
Figure 2. Relative cost to fix the same defect by stage, from one vendor’s illustration in the TRI SPI closed-loop white paper [3]. Field returns are not shown.
AOI false calls are a labor and quality problem at the same time
One vendor’s white paper reports that AOI machines raise alarms on 5 to 70 percent of passing throughput, that up to 95 percent of those alarms can be false calls, and that manual review has been shown to carry a 30 percent chance of missing a real error [5]. Treat those as a vendor’s range. The mechanism is familiar to anyone who has stood at a review station: tight thresholds catch more real defects and generate more false calls, reviewers learn to pass the familiar ones, and eventually they pass a real one.
The numbers can be brought down. A contract manufacturer described in I-Connect007 cut its AOI false-failure rate from above 1 percent to below 0.5 percent with separate product databases and multi-variable classifiers, reaching 375 ppm real calls against 230 ppm false, and saw ICT first-pass yield rise from under 75 percent to over 93 percent across three lines [6]. A 2024 study classified pre-reflow AOI “NG” calls that later passed post-reflow inspection, and a random forest model trained on about 30,000 points identified those false calls with 89.3 percent accuracy [7].
Placement: nozzles and feeders wear before they fail
A Rockwell Automation team tracked reject percentage and cumulative rejects per nozzle over work orders and found that instantaneous readings did not reveal the problem; the trajectory of each nozzle’s rejects did. Their scoring rule cut troubleshooting from 45 minutes to 15 or less, and they report it helped avoid throughput losses of up to 35 percent in components per hour [8]. Most placement platforms already count pick and vision rejects by feeder and nozzle. The work is collecting the counts per board, keeping them over time, and alerting on the trend.
Reflow: record what each board saw
A typical lead-free SAC305 profile from one paste supplier calls for a 1 to 3 °C per second ramp, a 30 to 90 second soak between 150 and 200 °C, 30 to 90 seconds above liquidus, a 230 to 250 °C peak, and a cooling rate faster than 4 °C per second; the supplier notes that the product’s own quality requirements should define the final profile [9]. IPC-7530B, revised in 2025, is the industry guideline for developing those profiles [10]. A profiler run tells you the oven can hit the window. Zone actuals, conveyor speed, and board-in and board-out events, tied to each serial number, tell you whether a given board did.
Machine-to-machine standards: what they give you
Two IPC standards now cover most of the connectivity on a modern line, and older machines cover the rest through logs and adapters.
IPC-CFX (Connected Factory Exchange, IPC-2591) defines the messages machines send about work, materials, faults, and quality. It runs on AMQP 1.0 with JSON-encoded payloads and supports both request/response and event messages; IPC publishes a free SDK, and version 2.0 was released in March 2025 [11][12]. A CFX-capable SPI or AOI can publish inspection results that any CFX consumer can read without a vendor-specific driver.
IPC-HERMES-9852 replaces the SMEMA conveyor handshake. It uses Ethernet with TCP/IP and XML, keeps SMEMA’s board handover behavior, and passes board information down the line, including the board’s unique identifier, barcode, dimensions, and conveyor speed, so a line needs fewer barcode readers [13][14]. IPC recognized it as SMEMA’s successor in 2018 [14]. On a line where Hermes carries the board ID from the printer to the AOI, every machine’s record can be stamped with the same serial number.
Neither standard covers every machine you own. Cogiscan’s CTO noted in 2020 that CFX had few real-life implementations at that point and that CAMX, CFX, and SECS/GEM would continue to coexist, so integrators must handle several protocols at once [15]. Plan for a mix: CFX where the machine supports it, Hermes where the conveyors do, and log file parsing, OPC UA, or vendor databases for the rest.
A reference architecture
The design goal is simple to state. Every machine record is stamped with the board ID and a synchronized timestamp, collected on the line, analyzed on the line, and shared upward only in the form the plant chooses. Customer programs stay in a controlled store, and remote vendor access reaches only the machine it is meant for.
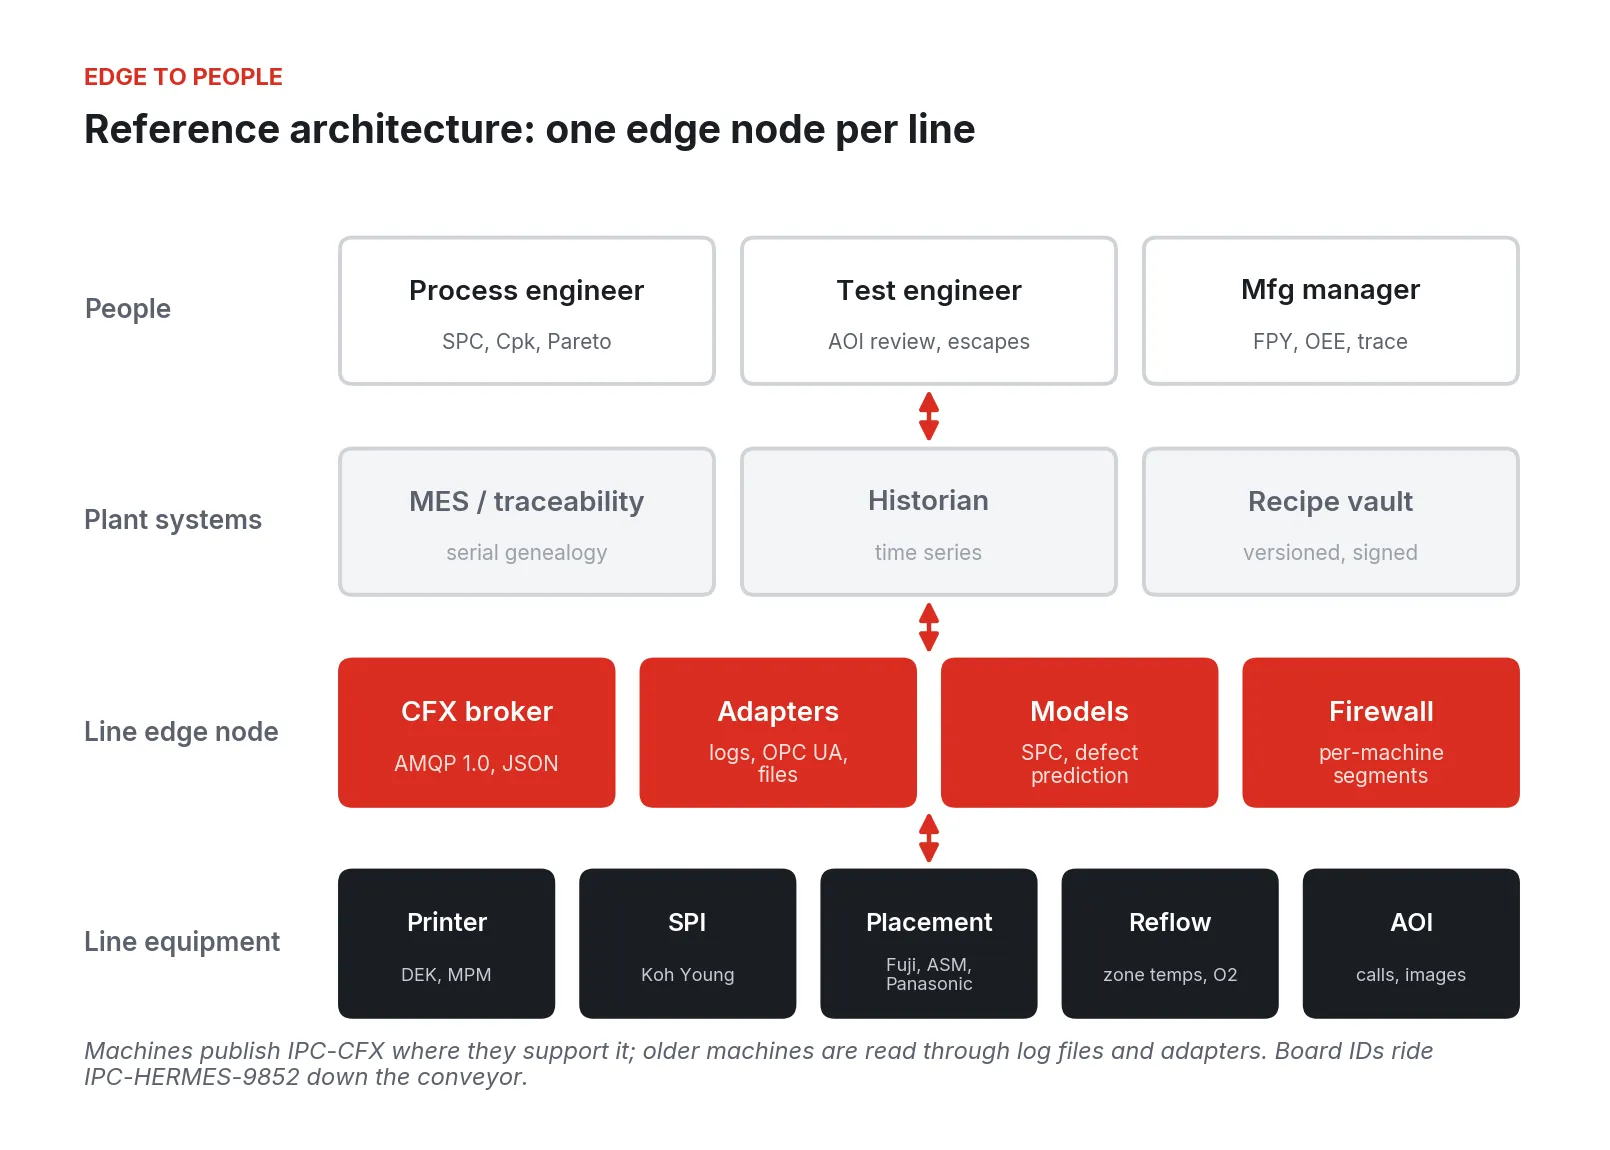
Figure 3. Reference architecture with one edge node per line. Machine data flows up through adapters and a CFX broker to plant systems and people; models and segmentation run on the node.
The layers work as follows.
1. Line equipment. Printer, SPI, placement, oven, AOI, and test stay as they are. Nothing on the machine changes except, where needed, enabling its CFX interface or log export.
2. Line edge node. One industrial PC per line runs the collection and analysis software: an AMQP broker for CFX messages, adapters for machines that only write log files or databases, a time-series store, and the SPC and prediction models. It also enforces the network boundary for each machine.
3. Plant systems. MES or traceability software, the plant historian, and a versioned recipe store receive what the line produces. Recipes and programs flow down only from the controlled store.
4. People. Process engineers get SPC and Cpk on deposit volume and placement offset; test engineers get false-call Paretos and escape analysis; managers get first-pass yield and line performance.
Placing the analysis at the line instead of in a cloud service has practical reasons. SPI and AOI produce large result sets per board, and a printer feedback decision is only useful if it reaches the printer within a few boards. Many EMS customers also restrict where their design data and inspection images may go, so keeping them on the plant network avoids a contractual question before it starts.
Walking the line: what to do at each machine
Work in the order defects flow, cheapest fixes first.
Printer and SPI
- Turn on SPI result export for every board, including passing ones. Many lines store only failures, which makes trending impossible.
- Put individual deposits on SPC charts by pad group and stencil aperture type, with wipe events and paste additions marked on the same time axis. Volume drift that resets after each wipe tells you the wipe interval is too long.
- Set SPI limits from cost, using the method in Huang et al.: estimate what a false reject and an escape each cost, and pick the limit that minimizes the total [1].
- Close the loop on offsets. Ufford and Mohanty showed that feeding SPI X, Y, and theta offsets back to the printer with a 50 percent correction factor brought registration to target within 4 to 8 boards in controlled tests [2]. TRI describes the same pattern plus automated stencil cleaning triggered from volume results and feed-forward of skip-board data downstream [3]. Many printer and SPI pairs from the same vendor already support this; for mixed pairs, the edge node can mediate it.
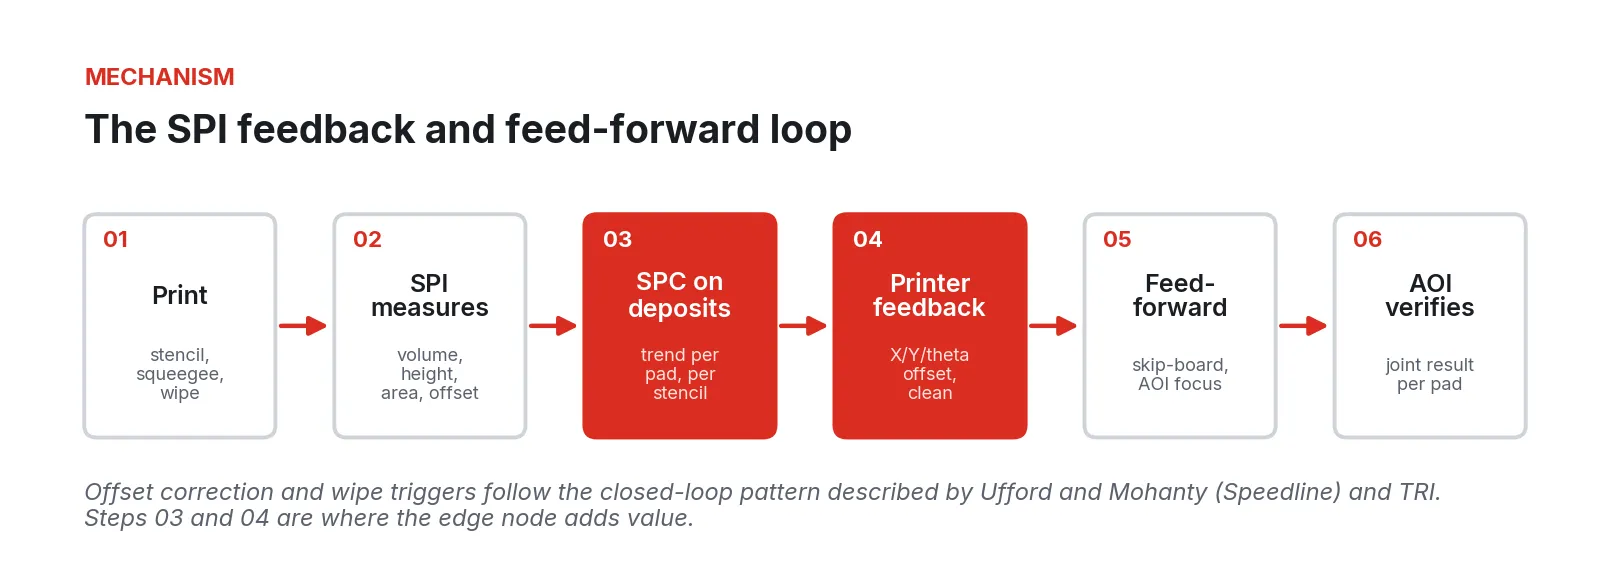
Figure 4. The SPI feedback and feed-forward loop. Offset correction and wipe triggers follow the closed-loop pattern described by Ufford and Mohanty [2] and TRI [3].
Consider a line where SPI reports average volume on a group of 0.4 mm pitch pads climbing slowly between wipes. Nothing has failed yet. A chart that shows volume against boards since the last wipe makes the fix obvious, and a rule that triggers a wipe when the trend crosses a warning line takes the decision off the operator. That is the kind of check this layer exists for.
Placement
- Collect pick and vision rejects per feeder slot and nozzle, per board or per work order, and keep at least a few months.
- Score each nozzle on its trend, following the Rockwell approach, and alert maintenance before the reject rate reaches a fixed threshold [8].
- Record reel ID and component lot per placement. That is what lets a component lot problem be traced to specific serial numbers instead of a date range.
Reflow
- Log zone actuals, conveyor speed, and O2 ppm continuously, and mark board-in and board-out events with the board ID.
- Compare each board’s oven conditions against the profile window that was validated for that product [9][10]. Flag boards that passed through during a zone excursion, even if AOI passed them.
AOI and test
- Capture every call with the operator’s verdict. The verdict is the training label for any false-call model and the raw material for a Pareto.
- Build a weekly false-call Pareto by part number, package, and algorithm. Tune the top five, then repeat.
- Join AOI calls back to SPI deposits and placement records for the same board and pad. When a real defect has no upstream warning, that is a gap in your inspection; when a false call has no upstream anomaly, it is likely an algorithm or library issue.
- Join ICT and functional failures to AOI results to count escapes by defect type.
Defect prediction and SPC models at the edge
Once data is joined by board and pad, three kinds of models become practical, in order of difficulty.
1. SPC with rules. Western Electric or Nelson rules on deposit volume, placement offset, and nozzle rejects. Easy to audit, and often enough.
2. False-call classifiers. Trained on AOI calls and operator verdicts, these rank calls so reviewers spend time on the likely real ones [7]. They should prioritize review, and the plant should decide carefully before letting one auto-pass a call.
3. Defect prediction from upstream data. Models that predict a post-reflow defect from SPI and placement data for the same pad [4]. These need the most clean, joined data and should run in shadow for weeks before anyone acts on them.
Every model should carry a version, record the data it was trained on, and log each prediction against the eventual AOI or test outcome.
Where these projects go wrong
1. No common board ID or clock. Without Hermes or a barcode read at each machine, and without synchronized time, SPI, placement, and AOI records cannot be joined, and every analysis becomes a manual spreadsheet exercise.
2. Storing only failures. SPI and AOI databases configured to keep only rejects make trend analysis impossible. Disk is cheap; keep passing results for at least the life of a product run.
3. Assuming one protocol. Plans built only around CFX stall on the first older placement machine. Mixed protocols will persist for years [15].
4. Tightening AOI until it hurts. Tight thresholds raise false calls, and review fatigue lets real defects through [5]. Measure false calls and escapes together and tune against both.
5. Laboratory results treated as production results. Ufford and Mohanty noted their closed-loop results came from controlled experiments and called for validation in high-volume production [2]. The same caution applies to any published model accuracy, including the 89.3 percent false-call result [7].
6. Models without labels. If operator verdicts at the review station are not recorded, there is nothing to train or test a classifier against.
7. Dashboards with no owner. A chart nobody is assigned to read is a cost with no return. Every alert needs a named role and a response.
Protecting customer recipe and program IP
For an EMS provider, the placement programs, stencil designs, AOI libraries, and test programs on the line belong to customers. Losing control of them breaches customer agreements as well as security policy. Common exposures are programs on shared drives, vendor remote-access tools that reach the whole line network, shared logins at line PCs, and no record of who exported what.
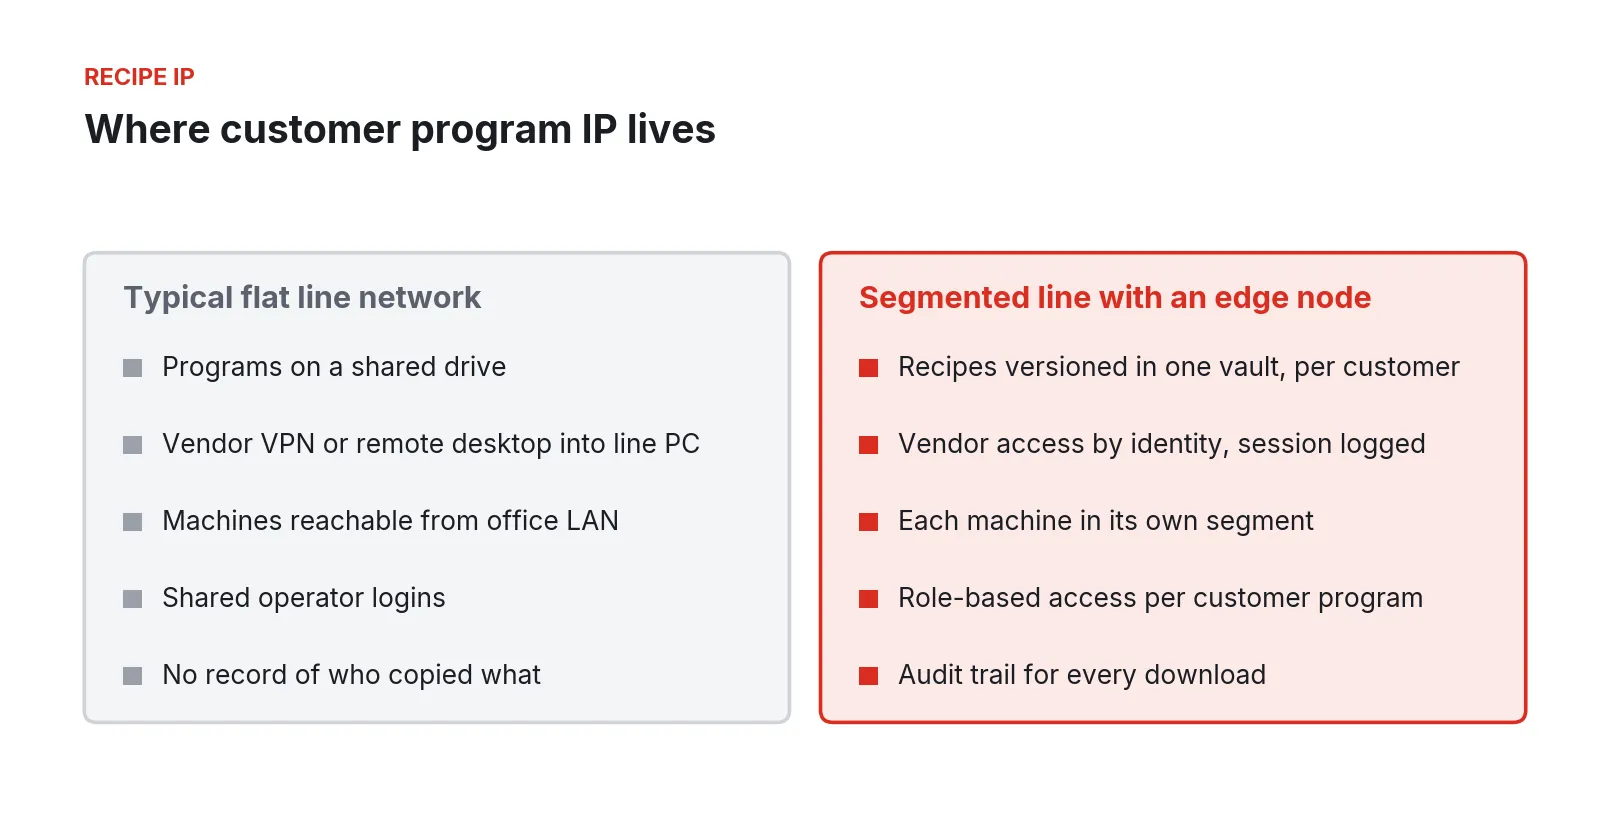
Figure 5. Where customer program IP lives on a typical flat line network compared with a segmented line behind an edge node.
The relevant frameworks describe the controls in their own terms. Your compliance program owns the mapping and the evidence; the architecture can support it.
1. ISA/IEC 62443. Group assets into zones by function and risk, control the conduits between them, and set target security levels from a risk assessment [20]. On an SMT line, each machine or machine group can be its own zone, with the edge node as the conduit to plant systems.
2. NIST SP 800-82 Rev. 3. NIST’s guide to OT security covers threats, vulnerabilities, and countermeasures for systems that monitor and control physical processes, and is a practical companion to 62443 for plant teams [18].
3. NIST SP 800-171 Rev. 3. Where a plant builds for defense customers and handles Controlled Unclassified Information, the 17 control families, including access control, incident response, and supply chain risk management, apply to system components that process, store, or transmit CUI [19]. Customer drawings and programs may fall under it.
4. IPC-1792. IPC’s 2023 standard on cybersecurity incidents in the manufacturing supply chain calls for detecting incidents, identifying affected products, and notifying customers quickly, and recommends segmenting factory networks so that affected units can be listed per segment [17].
5. IPC-1782. IPC’s traceability standard defines four levels for both material and process traceability, scaled to product risk and IPC class [16]. The board-level joins in this paper are what higher process-traceability levels require.
A phased rollout
The plan assumes one line, the existing team, and no machine replacement.
Figure 6. Phased rollout on one SMT line, from baseline to the second line.
1. Weeks 0 to 2: Baseline. List every machine, its software version, its export options (CFX, Hermes, logs, database), and who owns its programs. Measure first-pass yield, AOI false call rate, and escapes to ICT for the past month.
2. Weeks 2 to 6: Connect. Stand up the edge node, synchronize clocks, enable CFX where available, write adapters for the rest, and prove the board ID join on a single product.
3. Weeks 6 to 10: SPC and review. Put deposit volume and nozzle rejects on SPC charts, publish the weekly false-call Pareto, and assign owners to each alert.
4. Weeks 10 to 16: Predict. Run false-call ranking and defect prediction in shadow, compare against AOI and test outcomes, then enable printer feedback with an engineer approving each change at first.
5. Quarter 2 and after: Next line. Copy the node image and adapters to the next line, adjusting only for different machines.
What to do Monday
Pick the line with the most AOI review time. Pull one week of AOI calls with operator verdicts and build a false-call Pareto by part number. Then check whether the SPI on that line stores passing results; if it does not, turn that on today. Compare the clocks on the printer, SPI, placement, oven, and AOI and write down the offsets. Finally, list where each customer’s programs for that line are stored and who can copy them.
None of this requires a platform, a capital request, or a vendor visit. It takes one line, one week of data, and someone willing to write down what they find. The table you build from it will tell you which of the steps in this paper is worth doing first.
Fireball Industries is EmberNet’s master integrator. Fireball’s engineers design, build, and support this work on SMT lines: connecting mixed-vendor printers, SPI, placement, reflow, and AOI equipment, joining the data by board, standing up the models and dashboards your engineers will own, and segmenting the line so customer programs stay where they belong.
Sources
- Chien-Yi Huang, Yueh-Hsun Lin, Kuo-Ching Ying, Chen-Liang Ku, “The solder paste printing process: critical parameters, defect scenarios, specifications, and cost reduction,” Soldering & Surface Mount Technology, 2011. https://smtnet.com/library/files/upload/397023%20211..223.pdf
- John Ufford and Rita Mohanty, Speedline Technologies, “Closed Loop Printer Control,” IPC technical paper, undated. https://www.electronics.org/system/files/technical_resource/E8&S19_03.pdf
- Ondrej Simecek, Test Research, Inc., “TRI White Paper: SPI Closed Loop,” version 1.0.0, 2013 (vendor). https://www.circuitnet.com/news/uploads/2/SPI_ClosedLoop_White_Paper_CN_1.pdf
- Hongya Lu, Haifeng Wang, Sang Won Yoon, Daehan Won, Seungbae Park, “Dynamic Predictive Modeling of Solder Paste Volume with Real Time Memory Update in a Stencil Printing Process,” Procedia Manufacturing vol. 38, 2019. https://www.sciencedirect.com/science/article/pii/S2351978920300159
- Siemens Digital Industries Software, “Smarter false call reduction for electronics manufacturing,” white paper, April 2023 (vendor). https://static.sw.cdn.siemens.com/siemens-disw-assets/public/1Ms1MRN5y1CWR4Q5aWqUCU/en-US/Siemens-SW-AOI-FCR-White-Paper.pdf
- Shane Downing and Mark Owen, “Implementing AOI in a CM Environment,” I-Connect007, undated. https://iconnect007.com/index.php/article/51662/implementing-aoi-in-a-cm-environment/51665?skin=smt
- Zhenxuan Zhang, Priyank Thakkar, Sang Won Yoon, Daehan Won, “Surface Mounting Production Line Automatic Optical Inspection (AOI) False Call Classification with Machine Learning Algorithms,” Flexible Automation and Intelligent Manufacturing (Springer), December 2024. https://www.researchgate.net/publication/386548009_Surface_Mounting_Production_Line_Automatic_Optical_Inspection_AOI_False_Call_Classification_with_Machine_Learning_Algorithms
- Gregory Vance, Francisco Maturana, Miki Cvijetinovic, Rockwell Automation, “Automating Detection of Pick-and-Place Nozzle Anomalies (An IIoT Case Study),” Circuits Assembly, December 19, 2019. https://www.circuitsassembly.com/ca/editorial/menu-features/32660-automating-detection-of-pick-and-place-nozzle-anomalies-an-iiot-case-study.html
- AIM Solder, “Profile Supplement for Lead-Free Alloys,” Rev. 4 (vendor). https://www.aimsolder.com/wp-content/uploads/reflow_profile_supplement_-_lead-free_solder_paste.pdf
- IPC, “IPC-7530B-2025, Guidelines for Temperature Profiling for Mass Soldering Processes (Reflow and Wave),” 2025 (ANSI Webstore listing). https://webstore.ansi.org/standards/ipc/ipc7530b2025
- IPC, “About CFX: The Global Standard for Smart Manufacturing Enablement,” accessed September 2026. https://www.electronics.org/about-cfx-global-standard-smart-manufacturing-enablement
- IPC, “IPC-2591, Connected Factory Exchange (CFX),” accessed September 2026. https://www.electronics.org/ipc-2591-connected-factory-exchange-cfx
- The Hermes Standard Initiative, “Some very basics about IPC-Hermes-9852,” August 2018. https://www.the-hermes-standard.info/wp-content/uploads/IPC-Hermes-9852_BasicSummary.pdf
- Wikipedia, “Hermes protocol,” accessed September 2026. https://en.wikipedia.org/wiki/Hermes_protocol
- André Corriveau, Cogiscan, “Communication Standards Galore!,” February 18, 2020 (vendor). https://cogiscan.com/opinions/communication-standards-galore
- Michael Ford, “IPC-1782: The New Dawn of Electronics Traceability,” Circuits Assembly, November 30, 2016. https://circuitsassembly.com/ca/magazine/26661-standards-1612.html
- IPC, “IPC-1792, Standard for the Management and Mitigation of Cybersecurity Incidents in the Manufacturing Industry Supply Chain,” 2023. https://www.electronics.org/media/11441/download
- Keith Stouffer et al., NIST, “SP 800-82 Rev. 3, Guide to Operational Technology (OT) Security,” September 28, 2023. https://csrc.nist.gov/pubs/sp/800/82/r3/final
- NIST, “SP 800-171 Rev. 3, Protecting Controlled Unclassified Information in Nonfederal Systems and Organizations,” May 14, 2024. https://csrc.nist.gov/pubs/sp/800/171/r3/final
- Dragos, “Understanding ISA/IEC 62443: A Guide for OT Security Teams,” January 8, 2025. https://www.dragos.com/blog/isa-iec-62443-concepts
- Koh Young America, “What Is Solder Paste Inspection?,” May 9, 2024 (vendor). https://kohyoungamerica.com/what-is-solder-paste-inspection/