

It is Tuesday morning and the state dairy inspector wants to see the last three months of CIP records for the silo and HTST circuits. Somebody walks to the QA office and comes back with a stack of circular charts and printouts. Most are fine. Two have a gap where the pen ran dry, one has a caustic wash that looks short, and the PCQI initials on a week in August are missing because she was on vacation. Nobody thinks the equipment was dirty, but nobody can prove it was clean.
The same plant runs its filler a few grams heavy since a weights and measures audit once found light packages, and keeps fermentation logs on a clipboard by the glycol panel. And if FDA called today asking which finished lots contained a given supplier lot of cream cheese base or fresh-cut produce, the answer would take most of a day of digging through receiving logs, batch tickets, and shipping records.
All three trace back to the same gap: the plant measures the right things at the PLC and then loses the context, the continuity, or the signature somewhere between the sensor and the binder. That gap costs time on every CIP cycle, product on every filled package, and days on every traceability request. This paper lays out what to measure, how to move it from the controls layer to a signed record without disturbing the controls, where these projects usually go wrong, and what a plant can do next week with or without outside help.
Figure 1. The scale of what the batch record is carrying. CIP figures from van Asselt et al. (2025); recall cost from GMA/FMI as cited by FDA (2018); response time from the FSMA 204 rule.
The numbers are large. A 2025 review in Food and Bioproducts Processing puts CIP at 10 to 20 percent of total dairy production time and 20 to 30 percent of the dairy industry’s water use, with typical cycles of 1.5 to 2 hours. [1] The European Commission’s Joint Research Centre notes that cleaning can account for up to 70 percent of a food and beverage site’s water use and effluent volume. [3] A study of an intelligent CIP system at a bottled-water plant reported that about 10 percent of capacity there was allocated to cleaning. [2] On the recall side, FDA has cited a Grocery Manufacturers Association and Food Marketing Institute estimate of $10 million in average direct cost per recall, with some multinational respondents reporting recalls above $100 million. [11] USDA’s Economic Research Service puts the cost of foodborne illness in the United States at $74.7 billion in 2023 dollars. [12]
Start with a self-check
Answer these for your own site and write the answers down; they are your baseline.
- For your most-used CIP circuit, can you pull the return temperature, flow (or supply pump run status), conductivity, and step times for any cycle in the last 90 days in under five minutes, and is the PCQI review signature on it?
- When a CIP cycle is cut short, by an operator, a valve fault, or a low tank level, does anything stop that equipment from going back into production before someone looks at it?
- For each fermenter or cultured-product vessel, do you have a continuous temperature record tied to the batch number, or a few hand readings per shift?
- What is your filler target relative to the label, how was it set, and when was the standard deviation behind it last measured?
- If FDA asked for every finished lot that consumed a specific incoming lot, and where those lots shipped, how long would it take to produce a sortable spreadsheet?
- When a PLC program, HMI, or historian server is changed, who records the change and how do you show that compliance records were not affected?
- Which of these records exist only on paper, and which exist only on one PC under a desk?
What actually needs to be measured
Most plants already have the sensors: return temperature and conductivity on the CIP skid, a checkweigher on the filler, and RTDs and glycol valves on the fermenters. What is missing is batch context, continuity, and the link between them.
CIP: time, action, concentration, temperature
The Sinner’s circle of cleaning (time, action, concentration, and temperature, often abbreviated TACT) maps directly onto what the Grade “A” Pasteurized Milk Ordinance asks for. Item 12p requires a recording device in the return solution line or another appropriate point that records the time and temperature the equipment is exposed to cleaning and sanitizing solutions. Where the recorder does not meet the chart specifications of Appendix H, the PMO accepts a continuous record of cycle time and temperature, solution velocity or pump operation, and the presence or strength of cleaning chemicals for each cycle, provided the record shows a typical pattern for each circuit so changes can be detected. [8]
The same item spells out what happens to the record afterward. Cleaning charts and electronic records must identify the plant, be dated and initialed by the person performing the activity, be reviewed and signed by or under the oversight of a PCQI within seven working days, be available onsite for at least the previous three months or since the last inspection, and be kept for at least two years. [8] Plants outside the PMO carry nearly the same obligation under 21 CFR 117, where sanitation controls that are preventive controls need monitoring, corrective action, and verification records. [7]
The full signal list
| Area | Signal | Typical source | Why it matters |
|---|---|---|---|
| CIP | Return temperature per step | RTD on return line, CIP skid PLC | Proves the wash reached temperature at the far end of the circuit |
| CIP | Supply flow or pump run status | Mag meter or VFD feedback | Action; low velocity leaves soil in long horizontal runs |
| CIP | Return conductivity | Inline conductivity sensor | Concentration; also shows rinse-to-wash interface timing |
| CIP | Step start/stop, circuit ID, route | CIP skid PLC sequencer | Time at condition per step; which valves and tanks were in the circuit |
| Pasteurizer | Hold temperature, divert valve position | Safety thermal limit recorder, HTST controls | Public health record; must not be touched by any supervisory system |
| Fermentation | Vessel temperature, glycol valve output | Tank PLC, RTD per zone | Ester, fusel, and diacetyl formation track temperature |
| Fermentation | Gravity or pH, dissolved oxygen where used | Inline analyzer or lab entry | Shows when the batch reaches terminal or set point |
| Filling | Individual package weights, rejects | Checkweigher, filler PLC | Average and MAV compliance; giveaway |
| Filling | Filler head ID, speed, bowl level | Filler PLC | Head-to-head variation is the most common hidden giveaway |
| Traceability | Lot scans at receiving, staging, packing | Handheld or fixed scanners | Links input lots to batches and outputs |
| HACCP | CCP values (metal detector checks, cook temps, chill) | Detector, PLCs, manual checks | Monitoring records for each CCP |
Fermentation temperature
Warm fermentation increases fusel alcohols, esters, acetaldehyde, and diacetyl; a controlled warm rest late in fermentation is also how diacetyl gets cleaned up. One brewing scientist’s guidance flags caution above 50°F for lagers and above 70°F for ales. [13] In cultured dairy, incubation temperature drives set time, acidity, and texture. Three hand readings per shift will miss the four hours a glycol valve stuck open overnight; a continuous record tagged with batch ID will not.
Fill weight
NIST Handbook 133 sets two tests a lot has to pass. The average net quantity must at least equal the label, and individual packages short by more than the Maximum Allowable Variation are unreasonable errors, which overages in other packages do not offset. [9] The Category A sampling plan sets the sample size and the number of packages allowed to exceed the MAV for each lot size. [10]
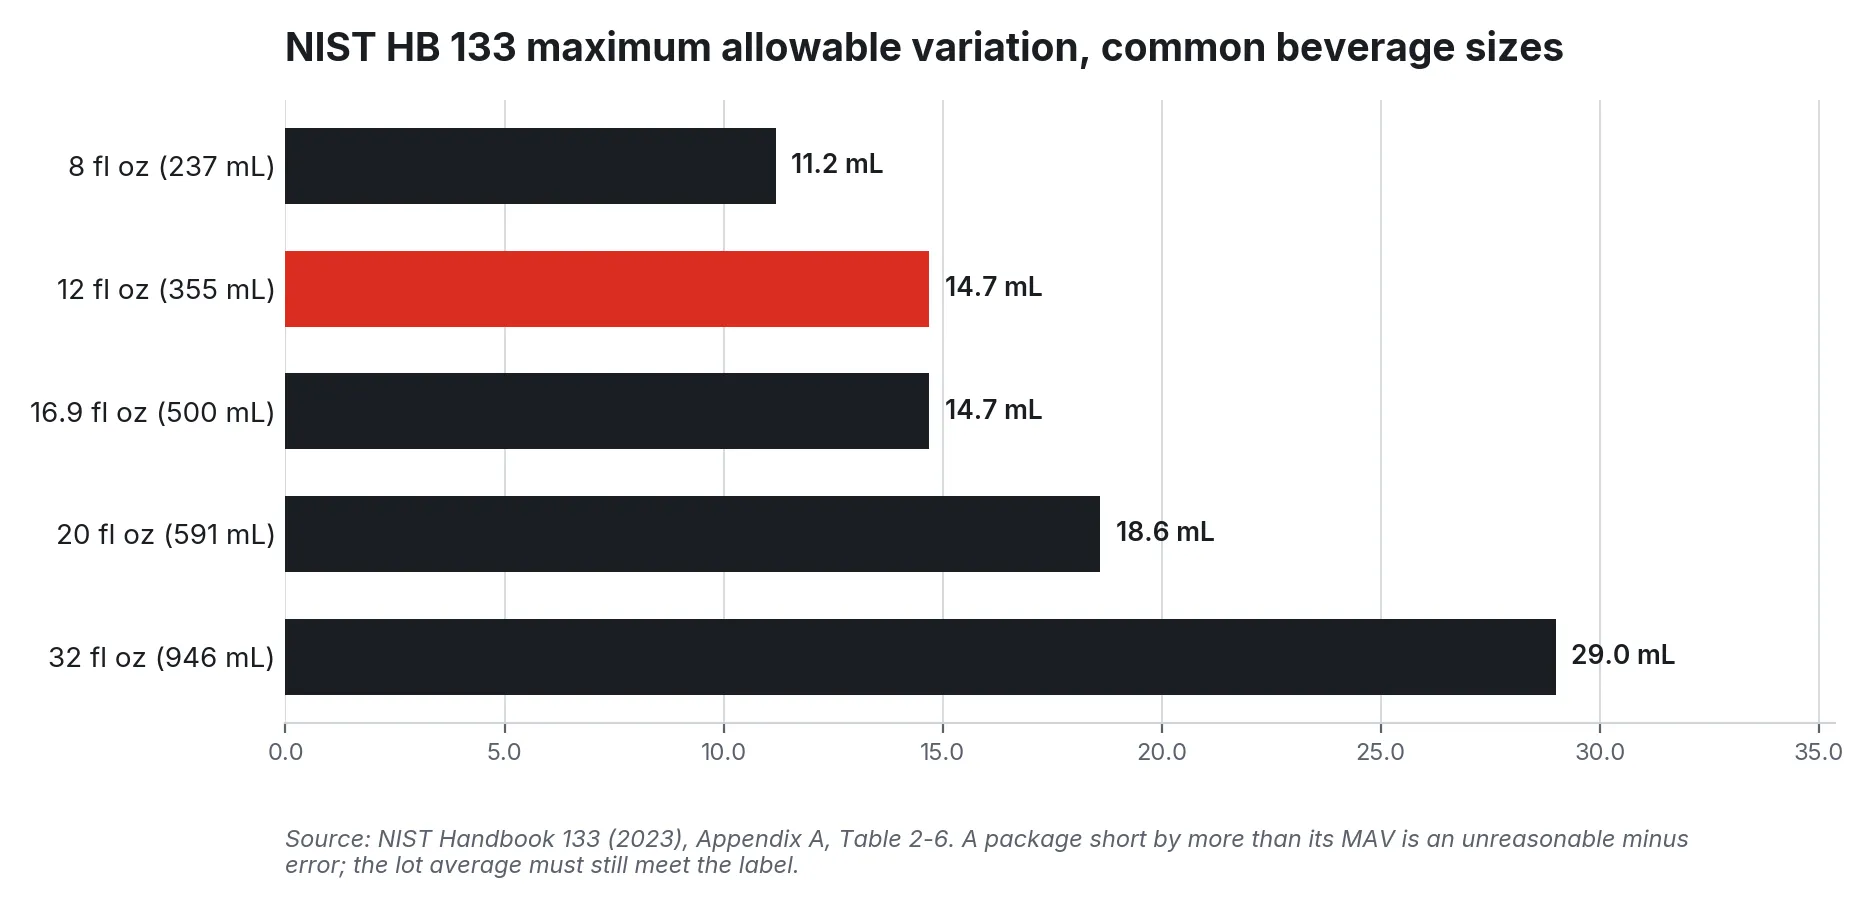
Figure 2. NIST Handbook 133 MAVs for common beverage package sizes labeled by volume. Data from NIST Handbook 133 (2023), Appendix A, Table 2-6.
The cost of compliance shows up as giveaway. In a worked example published by a principal statistician, a 680 g feta package with a 9.5 g standard deviation needed a target of 681.0 g to hold the risk of falling below the lower MAV limit to 0.2 percent; cutting average overfill from 19.2 g to 5 g on 10 million packages a year was worth about $780,000 at $2.50 per pound of product. [14] The useful lesson is the mechanism: the target is set by the standard deviation, and the standard deviation is a property of the filler that can be measured, trended and reduced head by head, if the data leaves the checkweigher.
Traceability under FSMA 204
FDA’s Food Traceability Rule covers foods on the Food Traceability List, which includes soft and fresh cheeses made from pasteurized milk, shell eggs, nut butters, fresh-cut fruits and vegetables, refrigerated ready-to-eat deli salads, and several finfish categories, along with foods that contain listed foods as ingredients in the same form. [6] The compliance date is now July 20, 2028, after Congress extended the original January 2026 date by 30 months. [4]
For a processor, the critical tracking events that matter most are receiving, transformation, and shipping. Transformation records must carry the traceability lot codes, descriptions, and quantities of each input lot used, plus the new lot code, location, date, product description, quantity, and a reference document for the output. [5] Records must be available to FDA within 24 hours of a request, and FDA can require an electronic sortable spreadsheet in that window during an outbreak or recall. [4]
A reference architecture
The design principle is simple: control stays where it is, and records are built one layer up. The CIP skid PLC still runs the cycle. The HTST public health controls stay sealed and untouched. The filler and checkweigher keep their own logic. An edge node reads tags from each, adds batch and circuit context, applies the record rules, and writes records that people review and sign.
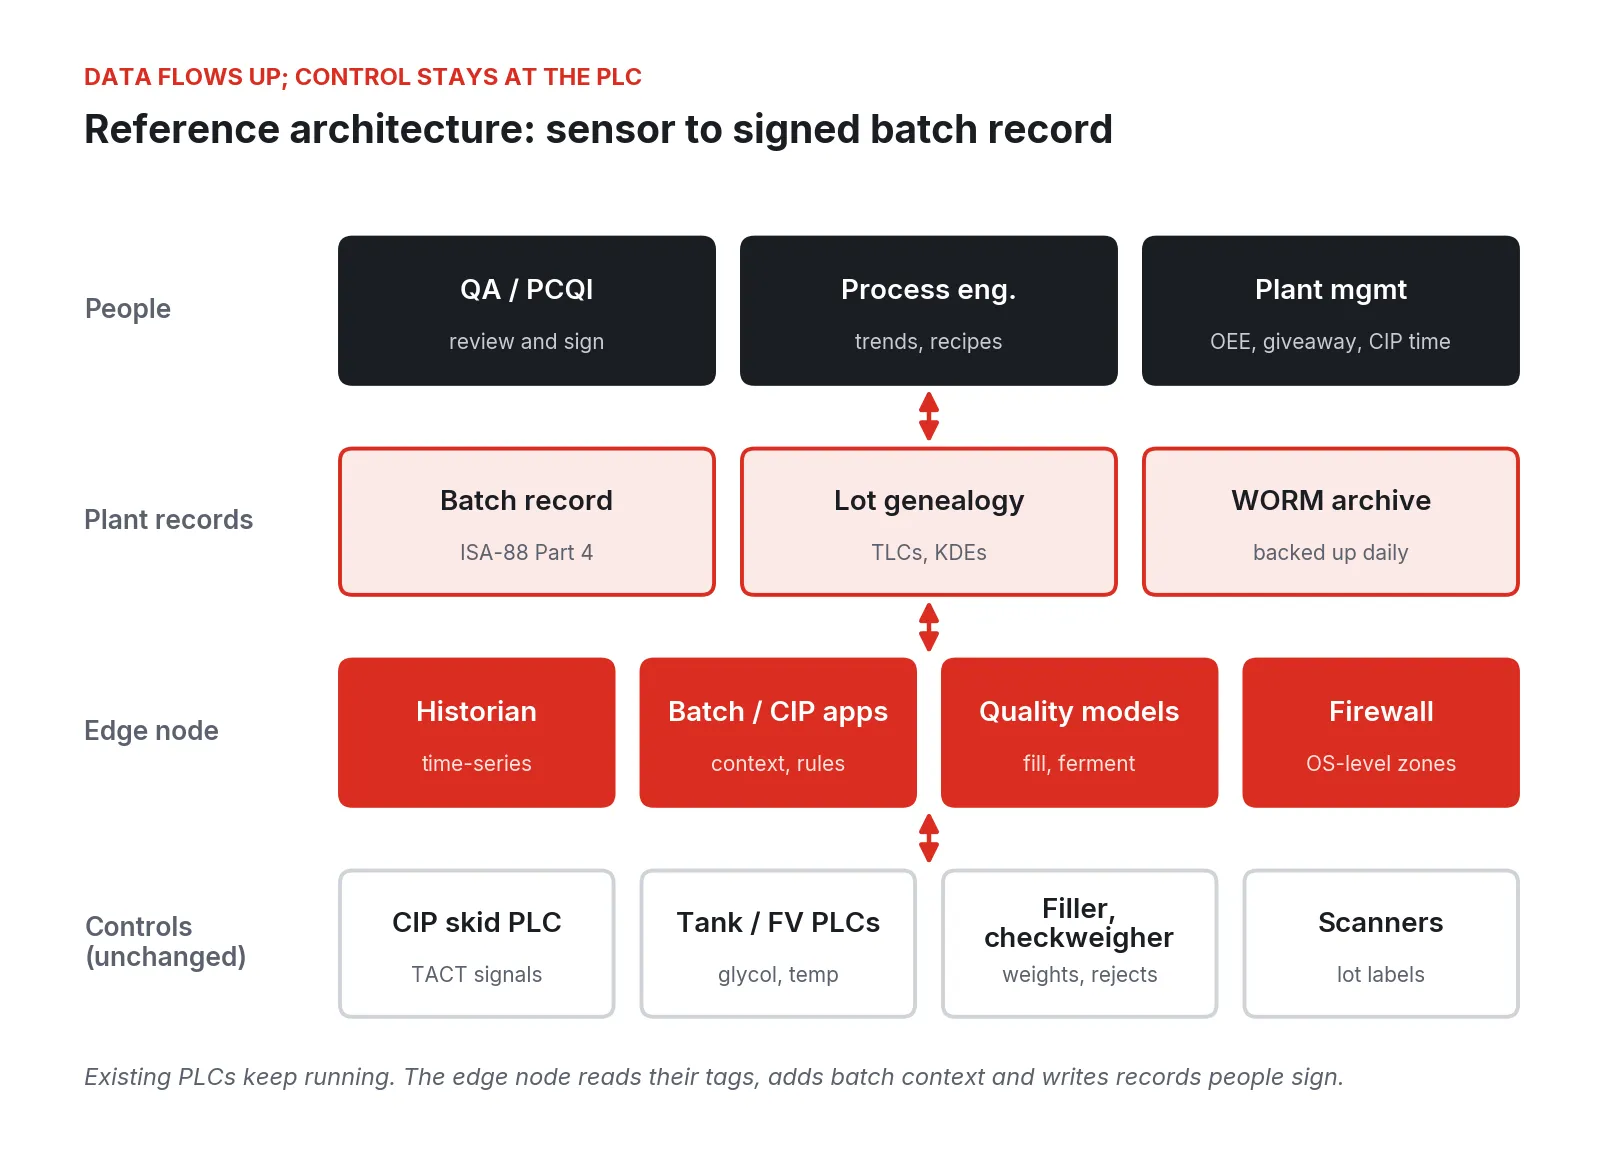
Figure 3. Reference architecture. Existing controllers keep control; the edge layer reads their tags, adds batch context, and writes the plant record.
Four layers are enough for most plants.
-
Controls (unchanged). CIP skid, tank, fermenter, filler, and checkweigher controllers and scanners. Reading their tags does not change their programs.
-
Edge node. A historian for continuous time-series data, applications that apply batch and CIP context and rules, quality models that run close to the process, and a firewall that separates the controls zone from the plant network.
-
Plant records. Batch records structured on ISA-88 terms, lot genealogy with traceability lot codes and KDEs, and a write-once archive with daily backup.
-
People. QA and the PCQI review exceptions and sign; process engineers work trends and recipes; plant management sees CIP time, giveaway, and OEE.
ISA-88 gives the record its vocabulary: Part 1 defines the physical and procedural models, and Part 4 a model for batch production records. [15] In those terms a CIP cycle is a procedure on a unit, and a yogurt batch is a control recipe with lots consumed and produced. That structure makes “show me every batch that used circuit 4 after the short caustic wash on the 12th” a query.
Walking the work, cheapest first
Step 1: Read and record one CIP circuit
Pick the circuit inspectors ask about most. Pull return temperature, conductivity, supply flow or pump status, and the sequencer step from the CIP PLC into a historian at one-second resolution. This is a read-only connection; the PLC program does not change. Within two weeks every cycle can be overlaid on one chart, showing the typical pattern the PMO describes, and short washes, slow heat-up, and late chemical interfaces stand out. [8]
Step 2: Turn trends into a CIP record
Write the rules each validated cycle must meet: minimum time above temperature at the return for each wash step, minimum conductivity during caustic and acid steps, pump running throughout. The application evaluates each cycle against its circuit’s rules and produces a record with pass, fail, or exception, the plant identity, operator initials, and the full trend attached. Exceptions route to a review queue so the PCQI can review and sign within the seven-working-day window. [8]
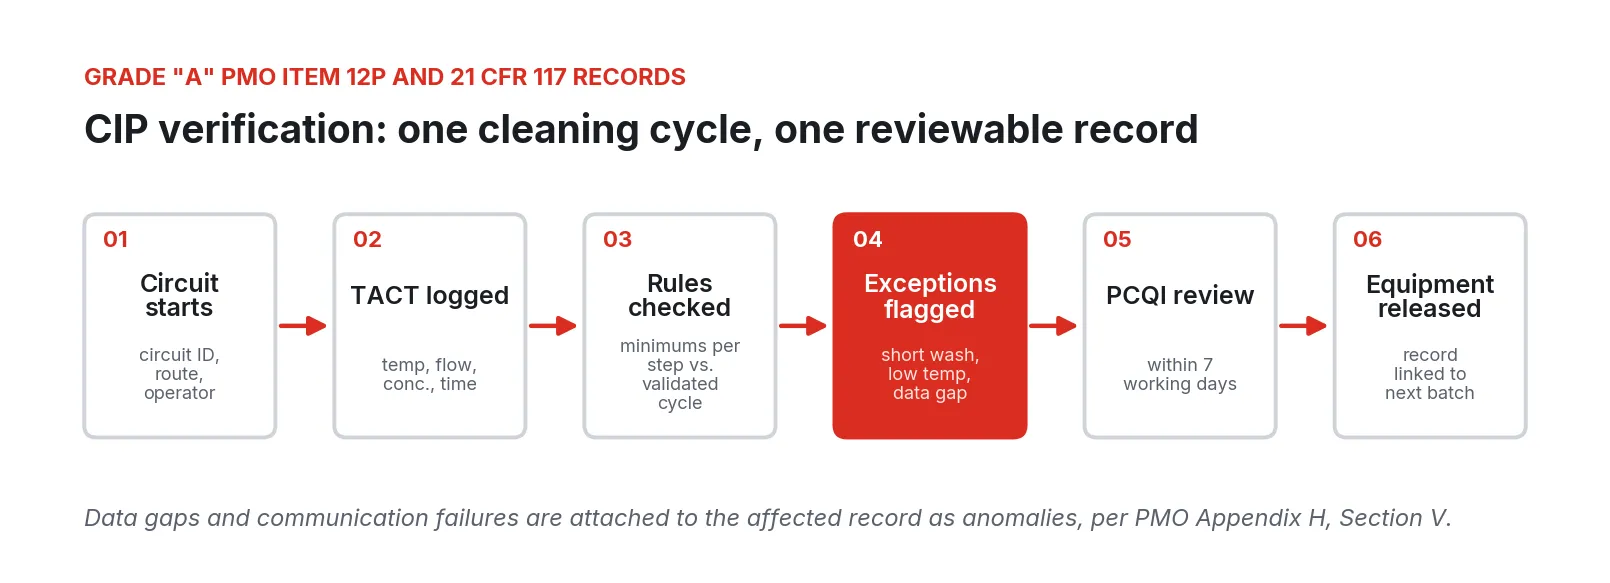
Figure 4. One CIP cycle from start to release. The highlighted step is where most paper systems fail: a short wash or a data gap is noticed weeks later, if at all.
PMO Appendix H, Section V describes what an electronic system replacing charts must do: data for CIP and storage tanks recorded at least every 15 minutes and backed up every 24 hours, a write-once, read-many data store, a written change record for software, drivers, networking, and servers, a seven-day side-by-side verification when charts are first replaced, electronic capture of required signatures, a UPS for 20 minutes, and an anomalies report attached automatically to any record a system or communication failure might have affected. [8]
Step 3: Close the loop on equipment release
Once the CIP record exists electronically, the next batch can check it. A tank whose last cycle failed or has an open exception shows as not released on the operator screen, and the batch application refuses to assign it until QA clears it. The interlock lives in the supervisory layer and in procedure; the CIP PLC’s sequence is unchanged.
Step 4: Fermentation and culture records
Add the vessel temperatures, glycol valve outputs, and any inline gravity or pH to the historian, tagged by batch. Set alarms on deviation from the recipe profile rather than on fixed limits, so a planned diacetyl rest does not page anyone at 2 a.m. and a stuck valve does.
Step 5: Fill weight and giveaway
Collect every checkweigher weight with filler head, time, and lot. Compute mean and standard deviation by head and by shift, compare the target to the MAV for the package size, and show the giveaway in grams and dollars. Fixing the worst heads first, then lowering the target to what the measured standard deviation supports, is the mechanism behind the worked example above. [14] The plant’s own compliance program sets the acceptable risk; the data makes it a decision instead of a habit.
Step 6: Lot genealogy and FSMA 204
Scan lots at receiving, at staging into a vessel, and at packing. The batch application records the transformation KDEs automatically: input lot codes and quantities consumed, new lot code assigned at the filler, location, date, and reference document. [5] Then run a mock request: pick a supplier lot and time how long it takes to produce the sortable spreadsheet of affected finished lots and their shipments.
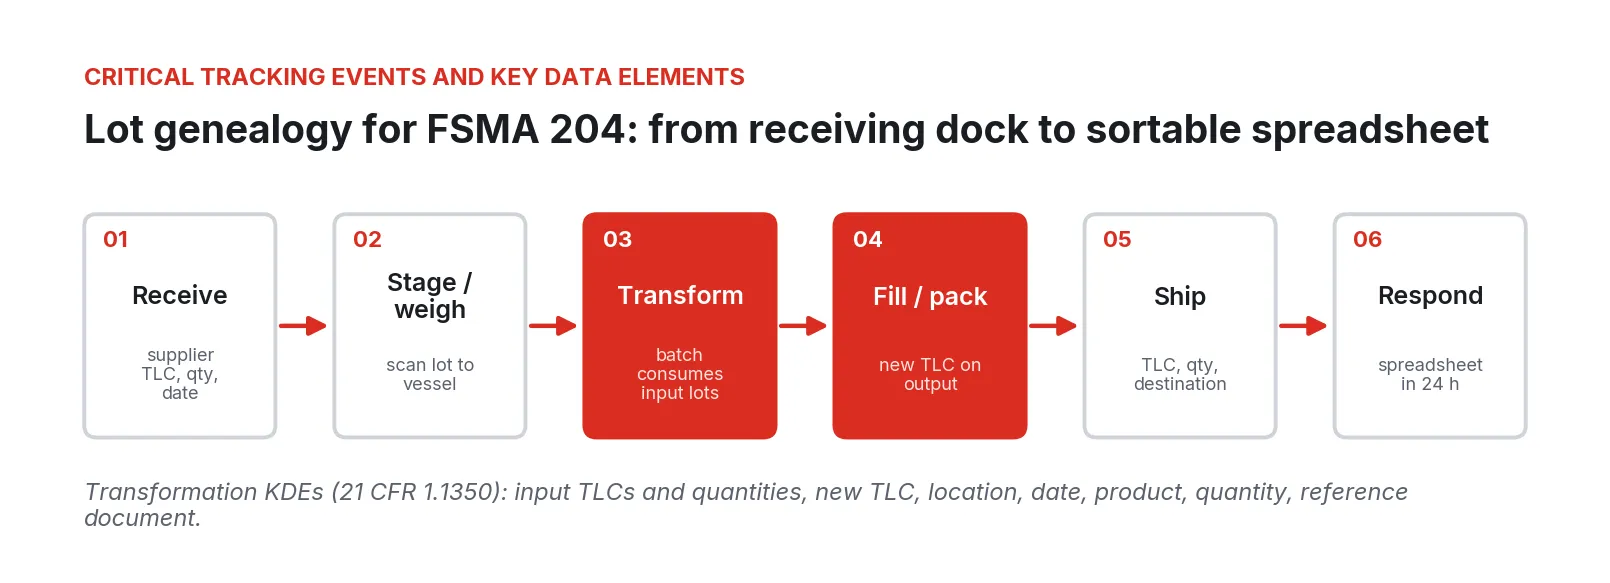
Figure 5. Lot genealogy across the critical tracking events a processor performs. The highlighted events are where the batch system creates the link between input and output lot codes.
Step 7: Models close to the process
With clean history in place, models become practical: predicting fermentation end time from the first day’s temperature and gravity curve, flagging a CIP cycle whose conductivity profile drifts from its circuit’s normal pattern, or recommending a filler target from the last hour’s standard deviation. Running them on the edge node next to the historian keeps them working when the WAN is down. They recommend; operators and QA decide.
Where these projects go wrong
-
Touching the public health controls. The PMO requires pasteurization limit controls to be set and sealed, and where a plant computer runs CIP it must connect to the flow diversion device and booster pump through relays that keep it from operating them unless the FDD is in CIP mode. [8] A supervisory project that writes to those tags, or puts the HTST controller on a flat network, creates a regulatory problem the plant did not have.
-
Replacing charts without the verification step. Appendix H requires seven consecutive days of electronic reports checked against the existing records before charts go away, signed by the vendor and the plant’s identified representative. [8] Skipping it leaves the first electronic records unsupported.
-
Silent data gaps. A historian that loses the CIP PLC for 40 minutes and interpolates across the gap produces a clean-looking record of a wash nobody saw. The PMO requires anomalies to be attached to the affected report; a separate system log does not satisfy it. [8]
-
Changes without a change record. A driver update, a new switch, or a PLC tag rename can break a record quietly. Appendix H requires a written record of every change to software, drivers, networking, or servers. [8]
-
Records nobody reviews. An electronic CIP record unsigned after seven working days is as noncompliant as a paper one. Build the review queue and the reminder into the design.
-
Genealogy that stops at the batch. Plants often record which lots went into a vessel but not which finished lot codes came out, or they record the finished lot without its quantity. FSMA 204 transformation records need both sides. [5]
-
A filler target nobody owns. Targets set after an audit scare tend to stay there. Without a measured standard deviation and a named owner, the giveaway becomes permanent.
Security and compliance
Food and agriculture is an active target. Food and Ag-ISAC counted 265 ransomware attacks on the sector in 2025 and identified 72 distinct threat actors; its April 2026 threat report notes that more than 97 percent of those actors use living-off-the-land techniques with legitimate administrative tools, and it recommends segmentation between IT and OT among its core defenses. [16] [17]
ISA/IEC 62443 is the consensus standard for securing industrial automation and control systems and organizes defenses around zones and conduits with defined security levels. [18] In this architecture, each line’s controllers form a zone; the edge node’s firewall is the conduit to the plant network; and the only paths into the controls zone are the ones the node allows.
The regulatory side is about records more than networks. 21 CFR 117 requires records to be original or true copies, accurate, indelible, and legible, created at the time of the activity, dated and timed where appropriate, and signed or initialed by the person performing it; they must be kept for two years, and offsite records must be retrievable within 24 hours. [7] Records kept to meet Part 117 are exempt from 21 CFR Part 11, but records that also satisfy other requirements are not, and the PMO’s electronic CIP provision refers to Part 11 directly. [7] [8] The required monitoring, corrective action, and verification records under 117.190 include calibration of process monitoring instruments, which means the RTD and conductivity probe calibrations belong in the same system as the CIP records they support. [19]
The architecture supports these requirements with continuous capture at the source, write-once storage, attached anomaly reports, signatures tied to individuals, and a change log. Compliance itself belongs to the site’s food safety plan and its PCQI.
One rule for updates: none lands on a node recording a live batch or CIP cycle. Schedule them for changeovers, verify the record path afterward and log the change as Appendix H requires.
A phased rollout
Figure 6. A phased rollout. Each phase delivers a usable result before the next one starts.
-
Weeks 1 to 4: read and record. One CIP skid and one filler, read-only, into a historian. Output: overlaid CIP cycles per circuit and a giveaway baseline by filler head.
-
Weeks 5 to 10: electronic CIP record. Rules per circuit, exception queue, PCQI review and signature, anomaly attachment, and the seven-day side-by-side verification before retiring charts on that circuit. [8]
-
Weeks 11 to 16: fill weight and SPC. Per-head statistics, target versus MAV, giveaway in dollars, a named owner for the target.
-
Months 5 to 8: batch and genealogy. ISA-88 batch records, lot scanning at receiving, staging, and packing, transformation KDEs, and a timed FSMA 204 mock request well ahead of July 2028. [4]
-
Months 9 and on: models at the edge. Fermentation end-time prediction, CIP pattern drift, filler target recommendations, each validated against the history the plant now has.
The architecture has been exercised end to end across distance. On September 29, 2026, an engineer in Austin, Texas, downloaded a PLC application from the CODESYS IDE to a virtual PLC running in a container on an industrial PC in Cleveland, Ohio, over EmberNet, with no VPN and no inbound port opened; that project is deployed with the client.
What to do Monday
- Pick the CIP circuit you argue about most and pull last month’s records for it. Count the cycles with gaps, missing initials, or steps that look short.
- Ask controls which tags on that CIP skid hold return temperature, conductivity, flow or pump status, and step number. Write them down.
- Pull one shift of checkweigher data, by head if it is available. Compute the mean and standard deviation, look up the MAV for the package in NIST Handbook 133, and work out what the target costs per year. [10]
- Check your products against the Food Traceability List. [6] If any are covered, pick one supplier lot from last month and time how long it takes to list every finished lot it went into and where those lots shipped.
- Find out who changes PLC programs, HMIs, and historian servers, and whether those changes are written down.
None of this requires a new platform or a capital request. It requires one circuit, one filler, a few weeks, and the discipline to write down what you find.
Fireball Industries is EmberNet’s master integrator. Fireball designs, builds and supports this work in food and beverage plants: reading CIP skids, fermenters and fillers without changing their programs, building CIP and batch records that QA can review and sign, setting up lot genealogy for FSMA 204, and running quality models at the edge on hardware the plant chooses, with Velasea industrial PCs validated for the platform.
Sources
- van Asselt, A. J., Huellemeier, H. A., Schuten, H. J., Augustin, W. “Is cleaning in place (CIP) ready for the future? A critical assessment.” Food and Bioproducts Processing, vol. 154, 2025. https://www.sciencedirect.com/science/article/abs/pii/S0960308525001944
- Jin, G., Jiang, Z., Sun, Y., Liu, Z., Liu, S., Wu, F. “Intelligent clean-in-place (CIP) system in beverage (healthy water) cleaner production.” Food Control, vol. 168, 2025. https://www.sciencedirect.com/science/article/abs/pii/S0956713524005942
- Dri, M., Antonopoulos, I. S., Canfora, P., Gaudillat, P. (European Commission Joint Research Centre). “Best Environmental Management Practice for the Food and Beverage Manufacturing Sector,” Section 3.5, “Environmentally friendly cleaning operations.” EUR 29382 EN, 2018. https://doi.org/10.2760/2115
- U.S. Food and Drug Administration. “FSMA Final Rule on Requirements for Additional Traceability Records for Certain Foods.” Updated July 24, 2026. https://www.fda.gov/food/food-safety-modernization-act-fsma/fsma-final-rule-requirements-additional-traceability-records-certain-foods
- Electronic Code of Federal Regulations. 21 CFR 1.1350, “What records must I keep when I transform a food on the Food Traceability List?” Accessed September 2026. https://www.ecfr.gov/current/title-21/chapter-I/subchapter-A/part-1/subpart-S/subject-group-ECFR4fcb9e7c0a4ecd6/section-1.1350
- U.S. Food and Drug Administration. “Food Traceability List.” Accessed September 2026. https://www.fda.gov/food/food-safety-modernization-act-fsma/food-traceability-list
- Electronic Code of Federal Regulations. 21 CFR Part 117, Subpart F, “Requirements Applying to Records That Must Be Established and Maintained.” Accessed September 2026. https://www.ecfr.gov/current/title-21/chapter-I/subchapter-B/part-117/subpart-F
- U.S. Food and Drug Administration. “Grade ‘A’ Pasteurized Milk Ordinance, 2017 Revision” (Item 12p; Appendix H, Section V). https://www.fda.gov/media/114169/download
- National Institute of Standards and Technology. “Handbook 133-2026, Chapter 1: General Information.” https://www.nist.gov/document/2026-hb-133-chapter-1
- National Institute of Standards and Technology. “NIST Handbook 133-2023: Checking the Net Contents of Packaged Goods” (Appendix A, Tables 2-1, 2-5, 2-6). February 2023. https://www.nist.gov/system/files/documents/2023/02/10/2023%20NIST%20Handbook%20133.pdf
- Ostroff, S. (FDA Deputy Commissioner). “The Costs of Foodborne Illness, Product Recalls Make the Case for Food Safety Investments.” Food Safety Magazine, June 20, 2018. https://www.food-safety.com/articles/5847-the-costs-of-foodborne-illness-product-recalls-make-the-case-for-food-safety-investments
- USDA Economic Research Service. “Cost Estimates of Foodborne Illnesses.” Updated June 16, 2026. https://www.ers.usda.gov/data-products/cost-estimates-of-foodborne-illnesses
- Holle, S. R. “Control of Off-Flavors From Fermentation.” BrewingScience.com, accessed September 2026. https://brewingscience.com/wp-content/uploads/2019/06/Control-Off-Flavors.pdf
- Wachs, S. (Integral Concepts, Inc.). “Optimizing Product Target Weights of Foods and Beverages.” Published on Advantive (software vendor) blog, April 16, 2020. https://www.advantive.com/blog/optimizing-product-target-weights-of-foods-and-beverages/
- International Society of Automation. “ISA-88 Standards.” Accessed September 2026. https://www.isa.org/standards-and-publications/isa-standards/isa-88-standards
- Industrial Cyber. “Food and Ag-ISAC reports 82% surge in ransomware attacks as Qilin, Akira and CL0P lead campaigns against sector.” February 12, 2026. https://industrialcyber.co/reports/food-and-ag-isac-reports-82-surge-in-ransomware-attacks-as-qilin-akira-and-cl0p-lead-campaigns-against-sector/
- Food and Ag-ISAC. “Examining the 2025 Food and Agriculture Cyber Threat Landscape.” April 6, 2026. https://www.foodandag-isac.org/post/examining-the-2025-food-and-agriculture-cyber-threat-landscape-insights-from-food-and-ag-isac-s-new
- International Society of Automation. “ISA/IEC 62443 Series of Standards.” Accessed September 2026. https://www.isa.org/standards-and-publications/isa-standards/isa-iec-62443-series-of-standards
- Legal Information Institute, Cornell Law School. 21 CFR 117.190, “Implementation records required for this subpart.” Accessed September 2026. https://www.law.cornell.edu/cfr/text/21/117.190