

It is 5:40 on a July morning and the fuel truck is on its second stop. The driver pulls up to a diesel well pump that should have run all night and finds it cold. The engine shut down on high temperature sometime after midnight, nobody was told, and the field it feeds has been dry for five hours in weather that will touch 115 °F by afternoon. Two miles away, an electric turbine pump tripped during a 9 p.m. brownout; the irrigator will find it on the afternoon check. Meanwhile, at the cooling plant, the harvest trucks are queued out to the road, and every hour a load of leafy greens waits in the sun is shelf life the buyer will never see.
Irrigated desert agriculture runs on pumps, wells, fuel, weather, and trucks, and most of it is still checked by someone driving to look. Many growers have tried sensors, and many pilots died the same way: the gateway lost cell coverage behind a canal berm, the battery box cooked in its first August, or the data landed in a vendor’s cloud where nobody could use it with anything else. In most of those cases the sensor itself worked; the network, the power supply, or the enclosure failed.
This paper is for growers, farm managers, irrigation district and research staff, and the crews who run pumps, cooling plants, and seed processors. It lays out what to measure first, which radio fits which job, how a private network can be built on towers and field relay nodes the region already has or can afford, and how a farm digital twin sits on top of it. It draws on a design and proof of concept in progress in a desert farming region of the US Southwest.
A self-check for your operation
Try to answer these about your own operation today, from records rather than memory.
- How many pump stations do you run, electric and diesel, and which five cost the most last season?
- When a pump trips, is the time until someone knows measured in minutes or in check runs?
- How many fuel runs did your diesel pumps take last season, and how many of those trucks arrived to a tank that did not need filling?
- Do you have a record of brownouts, phase loss and voltage unbalance at your pump panels, or only the utility’s word for it?
- Where on your ground does a phone lose signal, and has any sensor pilot ever failed because of it?
- How far is the nearest weather station from each field it is supposed to represent?
- If you share data with a researcher, a district, or a neighbor, can you say exactly which data, and could you take it back?
If more than two of these produce a shrug, the first gain is visibility into equipment already in the field, before any new sensor.
What irrigation pumping actually costs
The national numbers are large and mostly unmeasured. In USDA’s 2023 Irrigation and Water Management Survey, US farms spent $3.3 billion on energy to pump irrigation water, about $20,698 per farm with pumping expenses [1][2]. They drew from 456,058 on-farm wells, averaging 241 feet deep, and only 36 percent of those wells had a flow meter [2].
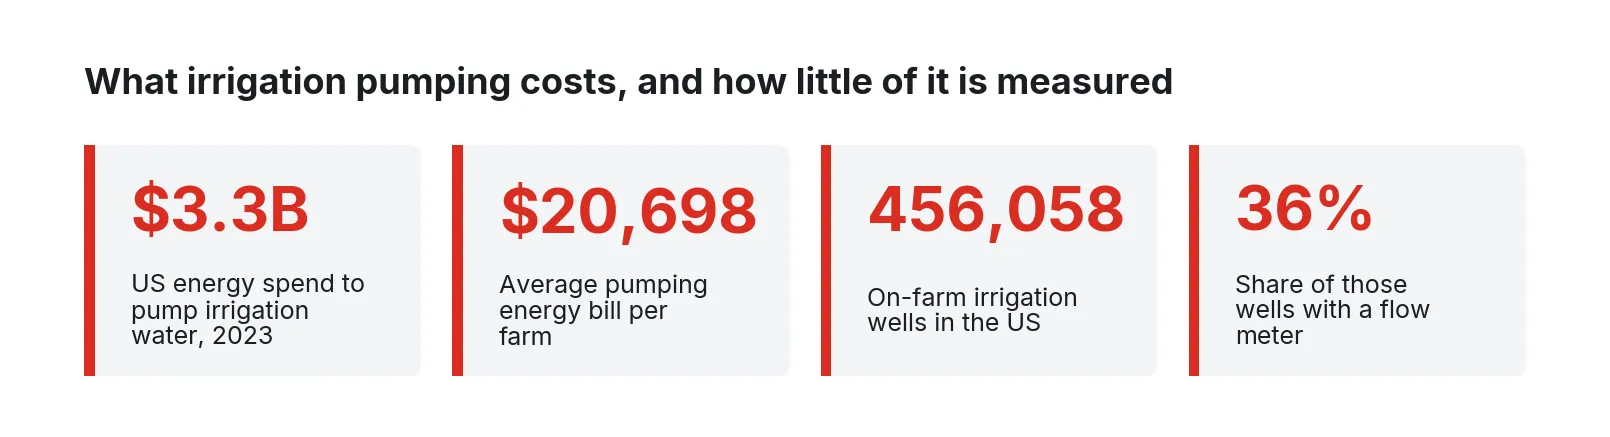
Figure 1. US irrigation pumping energy cost and well metering, 2023. Source: USDA NASS, 2023 Irrigation and Water Management Survey.
Electricity dominates the bill. Of the $3.26 billion in pumping energy expense broken out by source, $2.53 billion went to electricity across 470,936 pumps and $514 million went to diesel and biodiesel across 95,810 pumps [3]. Diesel pumps are the minority, and they are the ones that depend on a fuel truck to keep running.
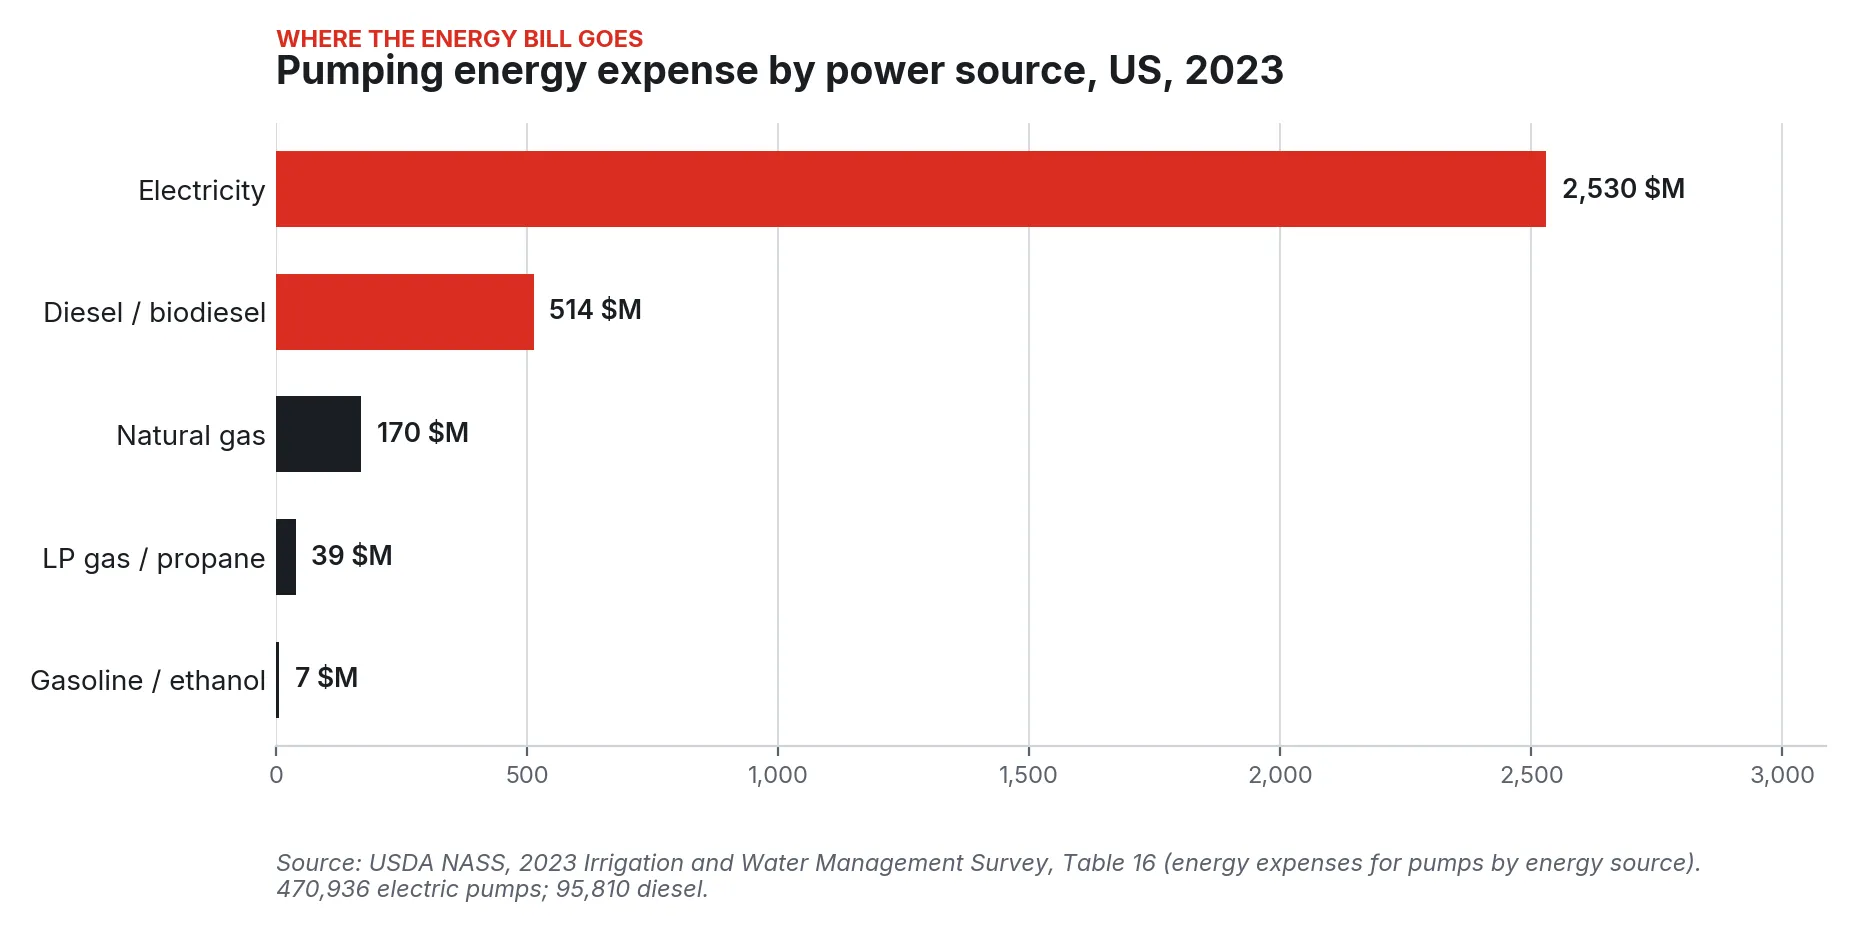
Figure 2. Irrigation pumping energy expense by power source, United States, 2023. Source: USDA NASS, 2023 IWMS, energy expenses for pumps by energy source.
Inside those totals sit two costs: wasted energy from pumps off their curve or motors on unbalanced voltage, and failures, including the crop that went without water while nobody knew.
How a pump failure is usually found
The US Department of Energy’s motor tip sheet describes the electrical half of this chain plainly. Voltage unbalance at the motor terminals produces current unbalance six to ten times larger, which drives vibration, losses, and overheating; the guidance is to keep unbalance below 1 percent, and NEMA practice requires derating above that [4]. In the tip sheet’s example, a 2 percent unbalance adds about 6.4 °C to a motor’s temperature rise, and winding insulation life halves for each 10 °C increase [4]. The same tip sheet suggests installing sensors that alarm on unacceptable unbalance, and notes that 120 Hz vibration should prompt an immediate voltage check [4].
The hydraulic half is just as familiar. Running a centrifugal pump with more suction lift than it was designed for causes cavitation, which sounds like gravel in the pump and eats the impeller [5]. A turbine column out of plumb wears the bearings and, if it touches the casing, vibration wears holes in it; submersible motors overheat without enough flow past them; and lightning is a leading cause of submersible failures [5]. Voltage at submersible motor leads must stay within plus or minus 10 percent of nameplate [5].
Figure 3. The typical pump failure chain. Electrical mechanism per US DOE Motor Systems Tip Sheet #7; cavitation and installation causes per NDSU Extension AE1057. The last two steps are the ones a field network removes.
Each of these causes leaves a signal before the pump stops: a voltage sag, a drifting phase current, a rising temperature, a changed sound.
What needs to be measured or connected
Start with what already exists in the pump panel and on the engine, then add sensors. The table below is ordered roughly by cost, cheapest first.
| Source | Signals | Why it matters |
|---|---|---|
| Motor starter, overload relay, VFD | Run/stop, trip cause, current per phase, drive faults | Trip time and cause, without a drive-by |
| Power monitor or protective relay at the panel | Voltage per phase, unbalance, sags, outages | Brownout log; evidence for the utility; motor life |
| Diesel engine controller | Running hours, rpm, coolant temperature, oil pressure, shutdown codes | Why the engine stopped and when |
| Fuel tank level sensor | Tank level and consumption rate | Fuel runs planned by need instead of habit |
| Discharge pressure and flow meter | Pressure, flow, totalized volume | Pump curve position; water applied per field |
| Well level sounder | Pumping and static water level | Suction and drawdown before cavitation |
| Acoustic or vibration sensor | Sound and vibration spectrum | Cavitation, bearing wear, 120 Hz electrical signature |
| Field weather station | Temperature, humidity, wind, solar radiation, rain | Evapotranspiration for scheduling; heat and frost |
| Soil moisture and canal or tank level | Moisture by depth, water level | Whether the water reached the root zone |
| Yard and gate sensors at plants | Truck arrival, gate-in, dock assignment, departure | Queue length and dwell time at harvest |
Pull data from an existing starter, drive, or engine controller through its own communication port and tags; that is integration work on the controller the pump already has, and it should leave the controller’s protection logic alone. Put voltage monitoring at the panel even where nothing else is affordable; it answers the brownout question with evidence. And treat a weather station as infrastructure that serves a neighborhood of fields.
Weather is worth more when it is shared
Oklahoma’s statewide mesonet is the best-documented case for dense weather networks in agriculture. A 2018 study in Agriculture, Ecosystems and Environment estimated about $183.1 million in cumulative benefit to Oklahoma dryland crop producers from mesonet information over the years 2006 to 2014, combining added profits and prevented losses, with the larger share coming from prevented losses, especially in drought years [6].
In irrigated desert agriculture the useful station is the one near the field, because microclimates along a river valley or mesa edge differ. A regional mesonet built from grower-owned stations, with each grower choosing to share weather while keeping pump and yield data private, gives everyone a denser picture than any one of them could afford.
Choosing the radio for each job
Four technologies cover a desert farm well, each in a different role.
Figure 4. Four radio options and the job each fits. Sources: Semtech and LoRa Alliance (LoRaWAN); Wi-Fi Alliance, IEEE 802.11ah and one vendor’s field test (Wi-Fi HaLow); 47 CFR Part 96 (CBRS).
LoRaWAN carries small readings a long way on very little power. One chipmaker’s overview puts a single gateway’s reach at more than 15 km in rural areas with line of sight [7], and the LoRaWAN specification puts data rates between 0.3 and 50 kbps [8]. One integrator’s field work found rural and semi-rural networks reaching beyond 20 km with line of sight, and showed that gateway height matters more than almost anything else [9]. That suits soil probes, tank levels, rain gauges, and weather stations, and rules out control and cameras.
Wi-Fi HaLow (IEEE 802.11ah) is Wi-Fi in the 902 to 928 MHz band, with native IP, relay support, and scheduled wake times for battery devices [11]. The Wi-Fi Alliance describes roughly 1 km of range for typical gear [10]. One chip vendor’s test in a California desert park carried 2 Mbps of UDP traffic at 15.9 km, the standard’s timing limit [12]; trade press notes that typical off-the-shelf equipment delivers 1 to 2 km at a couple of Mbps, and that each mesh hop reduces throughput [13]. HaLow is the right link between field relay nodes, to a pump-station node, and for IP devices such as cameras and controllers.
Private LTE or 5G on CBRS gives broadband from towers. CBRS occupies 3550 to 3700 MHz under a three-tier scheme of incumbents, Priority Access Licenses, and General Authorized Access, managed dynamically by a Spectrum Access System, and has been open for full commercial use since January 2020 [15]. Federal rules cap Category A base stations at 30 dBm per 10 MHz EIRP, Category B at 47 dBm, and end-user devices at 23 dBm, and require transmit power control on SAS instruction [14]. A 2023 field study of agricultural robotics in the UK found that public 4G could not support high-throughput, reliable applications in the field, while a private 5G standalone network outperformed it on every measure [16]. Private cellular is the backhaul from towers to the field and vehicles, and covers the dead spots carriers leave.
The broader gap is real. USDA reports that 22.3 percent of rural Americans lack fixed 25/3 Mbps broadband coverage, against 1.5 percent in urban areas, and its precision agriculture report estimates $18 billion a year in economic benefit from rural connectivity [17].
A reference architecture: tower, field, and headquarters
The design has three tiers: towers, field relay nodes, and headquarters.
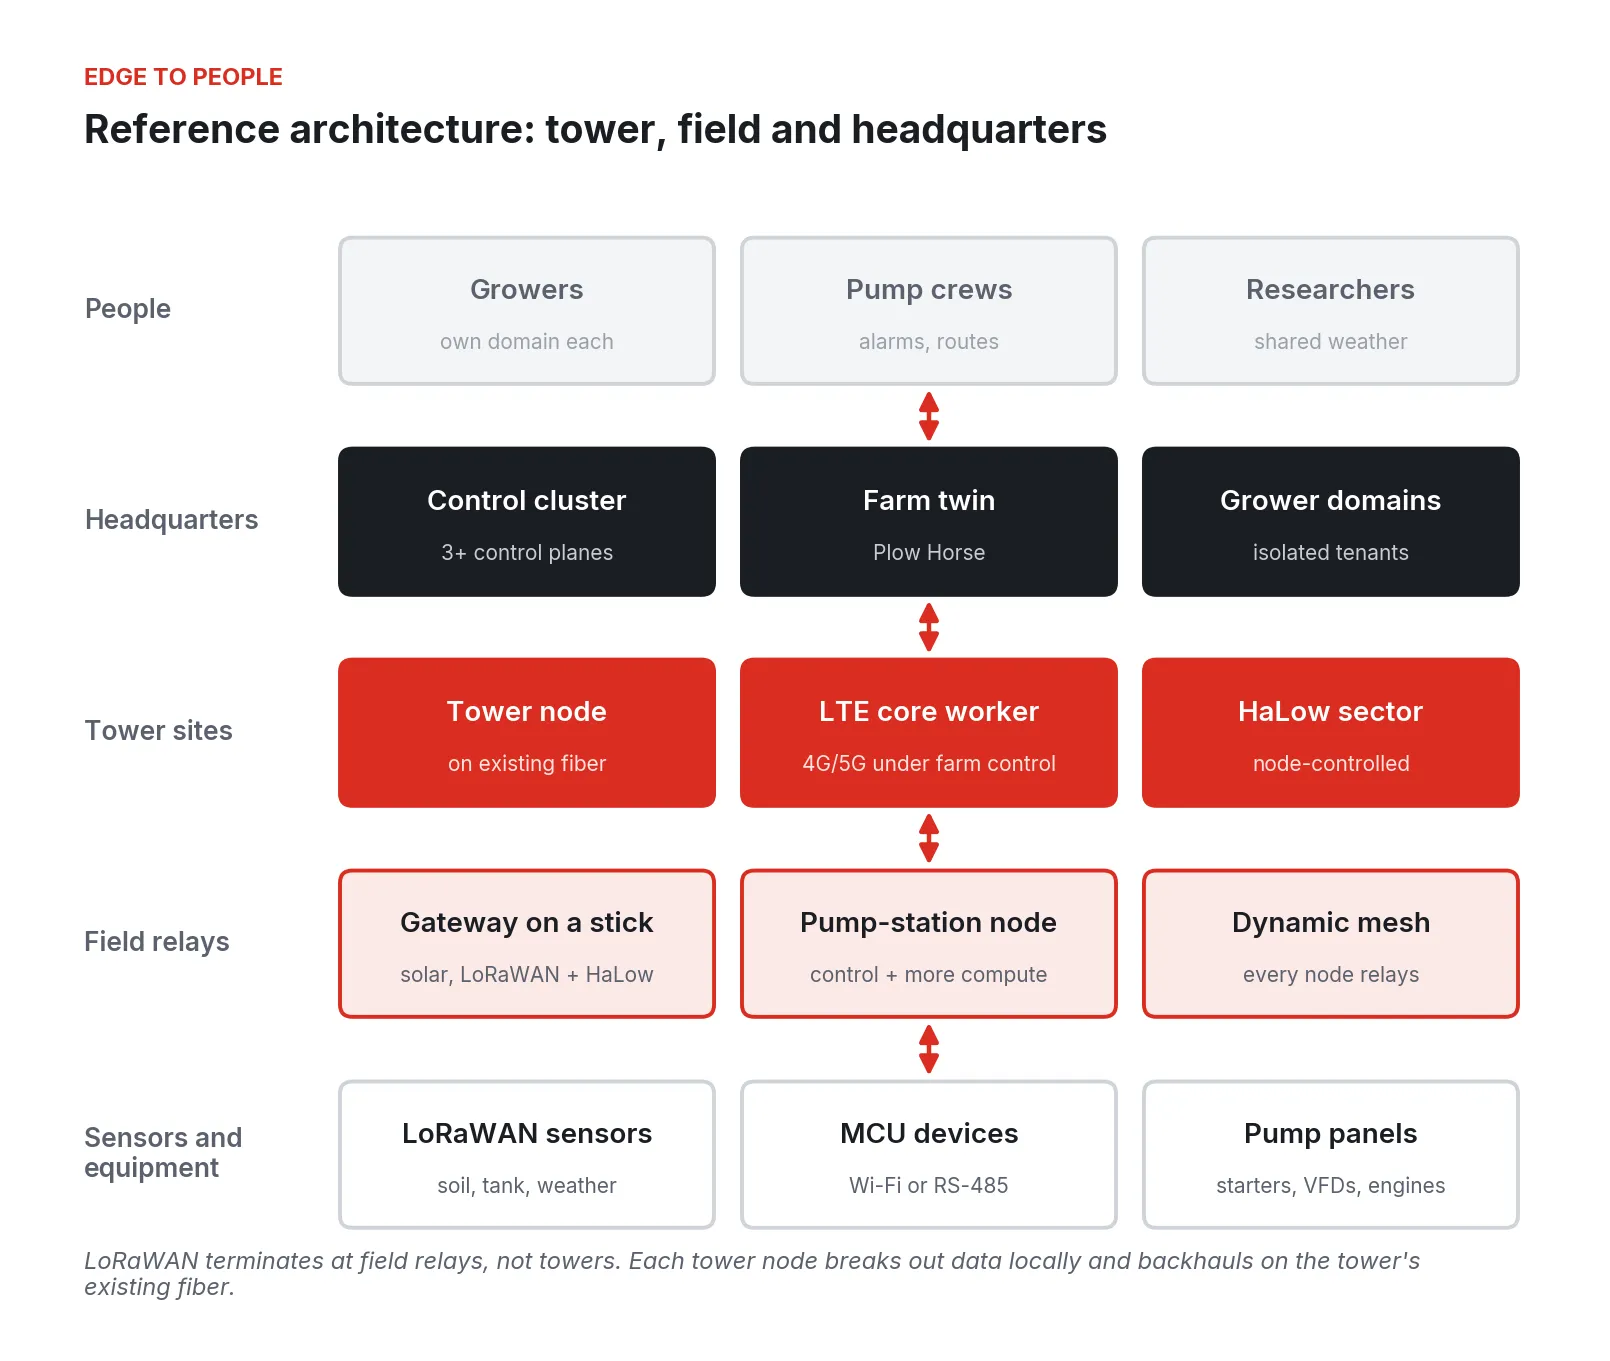
Figure 5. Reference architecture from sensors to people. LoRaWAN terminates at field relays; towers carry LTE, 5G, and HaLow; the control cluster and grower domains sit at headquarters.
Towers. Many farm regions already have towers with fiber backhaul, sometimes leased by a regional broadband effort. At each tower, an edge node breaks out data locally and directly controls the Wi-Fi HaLow sector gear. The LTE/4G core runs as a workload on that tower’s node. That makes it possible to bring orphaned 4G radios, left behind by a carrier or an earlier project, back into service under the farm’s own control. Tower radios are 5G, 4G, and HaLow; LoRaWAN does not belong on the tower in this design.
Field relay nodes. LoRaWAN gateways live on field relay nodes, close to the sensors they serve, and are orchestrated centrally against a registry of known sensors so a rogue or misconfigured device is noticed. Each field node carries a single HaLow radio, and nodes mesh dynamically: when a node drops or a path fades, traffic finds another way. Every relay node also does control, so every pump or gate that gets a node becomes a relay for its neighbors.
Headquarters. The control cluster sits back at headquarters, with each grower’s isolated data domain and the applications people use: pump alarms, fuel route plans, weather, yard queues, and the farm digital twin.
Two node types
Protocol conversion and meshing are universal: every node meshes over HaLow, backhauls over cellular with fallback, and acts as a LoRaWAN gateway. Nodes differ in power and compute.
1. Gateway on a stick. A post, a solar panel, and a box. It runs all the gateways plus light edge workloads, draws as little power as possible, and is always a worker node, never a control plane.
2. Pump-station node. Heavier compute in the panel or pump house, with more workloads: reading the starter, drive, and engine controller, logging power quality, running acoustic analysis, and holding local control logic.
Microcontroller-class sensors, the ESP32-type boards many research projects use, cannot run an edge platform themselves. The design direction gives them libraries so the node manages their networking, and also brings in Wi-Fi-only devices and serial-only devices, including RS-485 multidrop runs over distance.
Heat is a design input
Air temperature is reported in shade; one engineer’s measurements of outdoor enclosures found that full sun raised the effective ambient by about 19 °C over the air temperature [19]. On a 115 °F (46 °C) afternoon, that puts the inside of a sun-loaded box well beyond the commercial ratings of many boards. Electrolytic capacitors, the usual weak point in power supplies, roughly double their life for every 10 °C cooler they run, and halve it for every 10 °C hotter [18]; motor insulation follows the same rule [4].
The design rule is simple: field hardware must have a published operating-temperature rating suited to desert heat, and boards without one are ruled out. Then shade the enclosure and size solar and battery for the worst week of the year.
Project Horsepower and the Plow Horse farm twin
A network that reads pumps, wells, weather, and trucks produces a picture of the whole operation. Project Horsepower is Fireball Industries’ multi-domain digital twin system that turns that picture into something people can run the farm from.
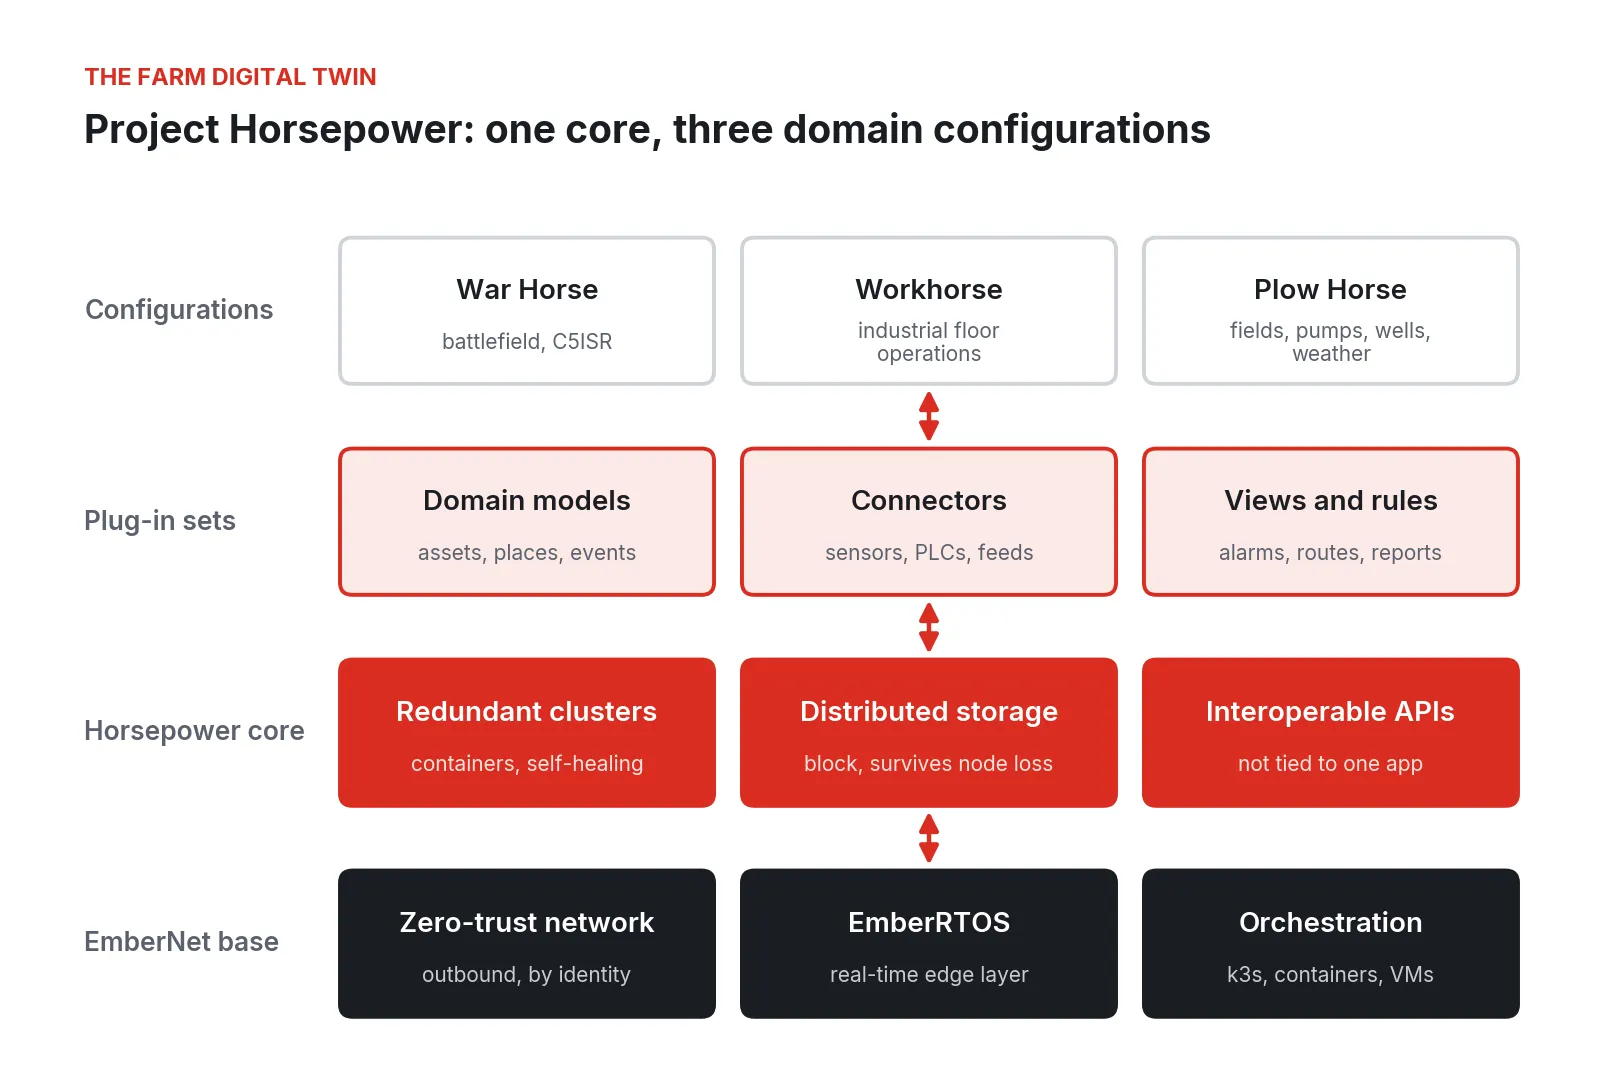
Figure 6. Project Horsepower: one core configured for three domains through plug-in sets, running on EmberNet. Plow Horse is the agriculture configuration.
Horsepower is one core configured for different domains through plug-in sets. Domain-specific capability lives in the plug-ins, so the core is not limited to any one application. Three configurations share it:
1. War Horse, for battlefield operational data: a battle manager originally built for the US military, based on C5ISR.
2. Workhorse, for industrial floor operations, positioned as a global operations manager.
3. Plow Horse, for agriculture and farm data.
The core runs on highly redundant container clusters with distributed block storage that self-heal when nodes are lost. It is built for interoperability. It has been updated with EmberNet’s zero-trust networking, and EmberRTOS gives it a deterministic real-time edge layer. Workhorse and Plow Horse are configurations of the same core.
What Plow Horse is designed to do
Plow Horse is the farm digital twin: fields, pumps, wells, weather, equipment, and yards, modeled as one connected operation on the network described above. In the design, each element carries its live state and history:
1. Fields hold their crop, irrigation set, soil moisture, and the evapotranspiration computed from the nearest weather stations.
2. Pumps and wells hold run state, power quality, fuel level, water level, flow, and acoustic condition, with trip causes recorded when they happen.
3. Weather comes from grower stations and shared mesonet feeds, with each station’s ownership and sharing rules attached.
4. Equipment and fuel trucks carry position and task, so refueling routes are built from actual tank levels and burn rates rather than a fixed loop.
5. Yards at cooling plants and seed processors track trucks from gate-in to dock to departure, so a plant can see its queue and a grower can see when to send the next load.
The twin is built to answer plain questions: which pumps are down and why, which tanks run dry before tomorrow’s fuel run, and how long trucks are waiting at the cooling plant this morning.
Penn State Extension notes that a one-hour delay in cooling can cut produce shelf life by a day or more [20], and NC State Extension describes vacuum cooling of lettuce taking 20 to 30 minutes once the product is in the tube [21]. When the cooler takes half an hour and the truck waits two hours in the yard, the yard is where the shelf life goes.
Walking through the work, cheapest first
Step 1: The pump panel
At the five worst pumps, read what the starter, drive, or engine controller already knows, and add a power monitor if there is none. Alarm above 1 percent voltage unbalance [4].
Step 2: Fuel and water
Add tank level sensors to diesel pumps and route fuel runs from the data. Add pressure and a flow meter where there is none; with only about a third of wells metered nationally [2], most operations are guessing at water applied and at where the pump sits on its curve.
Step 3: The relay node
Build one field relay node with every protocol working: HaLow mesh, cellular backhaul with fallback, a LoRaWAN gateway, and serial and Wi-Fi device support. A proof of concept can run a single control plane on the node; production runs at least three.
Step 4: Sound and condition
With a pump-station node in place, add acoustic or vibration monitoring on pumps with a cavitation or bearing history. Compare against that pump’s own baseline.
Step 5: Weather and the mesonet
Place stations where microclimates differ and agree in writing which growers share which feeds.
Step 6: Towers and yards
Bring tower nodes online for LTE, 5G, and HaLow coverage of the region’s dead spots, then extend to cooling plant and seed processor yards for truck queue tracking during harvest.
Where these projects go wrong
1. One radio for everything. LoRaWAN asked to carry control or cameras, or cellular asked to cover a field the carrier never built for. Match the link to the job.
2. Commercial-temperature hardware in the field. It works through the spring trial and fails in its first August. Demand a published rating, and plan for sun load on top of air temperature [18][19].
3. Batteries sized for average weather. Solar nodes die in the stretch of short days or dust. Size for the worst week.
4. Gateways mounted low. Range depends heavily on antenna height [9].
5. Mesh depth ignored. Each HaLow hop costs throughput [13]; keep most traffic to few hops.
6. Data in someone else’s cloud. If the grower cannot get the data back out, the pilot ends with the subscription.
7. Alarms with no owner. Every alarm needs a named person and a response time.
8. Touching protection logic. Monitoring a pump should never change how its overloads and interlocks behave unless that change is engineered, tested, and documented.
Security, spectrum and data ownership
NIST SP 800-82 Revision 3 is the US reference for securing operational technology, covering typical topologies, threats, and recommended countermeasures while respecting OT’s performance, reliability, and safety requirements [23]. Its themes map directly to a farm network: segment control equipment from everything else, control and log remote access, know every device on the network, and keep safety functions independent of the network.
The architecture supports those controls: each piece of equipment sits behind its own node and segment, remote access is outbound and identity-based, the sensor registry makes unknown devices visible, and actions are logged. The site’s security program owns its policies and their enforcement.
Spectrum. CBRS operation is governed by FCC Part 96: devices register with a Spectrum Access System, follow its instructions on channel and power, and stay within the EIRP limits for their category [14][15]. Wi-Fi HaLow and LoRaWAN operate license-free in the sub-GHz band but must still use certified equipment within the band rules.
Data ownership. The Privacy and Security Principles for Farm Data, established in 2014 with the American Farm Bureau Federation and adopted by dozens of organizations, state that farmers own information generated on their operations, that collection and sharing require the farmer’s explicit consent, that farmers should be able to retrieve their data, and that farm data should be protected with reasonable security safeguards [22]. A per-grower isolated domain is the technical form of those principles: each grower’s data stays in its own domain, and sharing, such as weather to a mesonet, is a deliberate, revocable choice.
A phased rollout
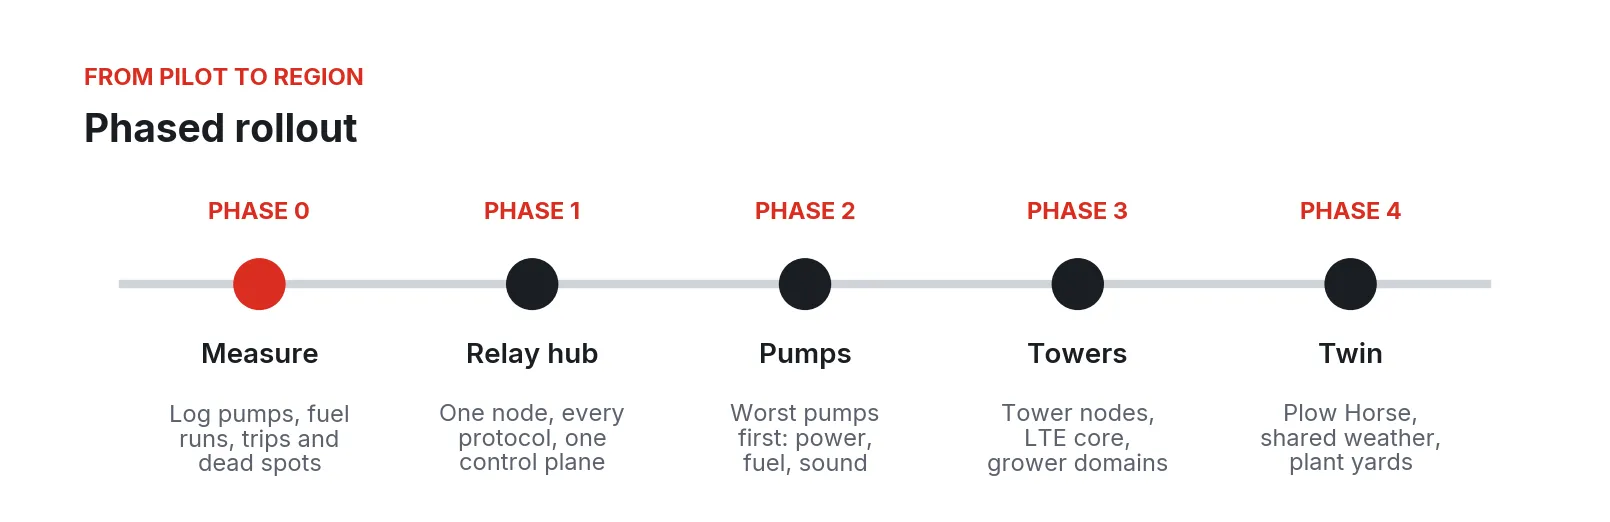
Figure 7. Phased rollout from measurement to a regional farm twin.
1. Phase 0, measure. Inventory pumps, wells, and dead spots; log a season of fuel runs, trips, and brownouts.
2. Phase 1, relay hub. Build one fully working relay-node hub with every protocol, then package it smaller once quantities are known.
3. Phase 2, pumps. Nodes on the worst pumps first, with alarms that reach a named person.
4. Phase 3, towers. Tower nodes, the LTE core, grower domains, and at least three control planes.
5. Phase 4, twin. Plow Horse across fields, pumps, weather, and plant yards.
What to do Monday
Pick the pump you argue about most. Pull its trip history, its fuel log, and its utility bills for last season, and write down how many times someone drove out to find it stopped. Put a voltage monitor on its panel and a level sensor on its tank, even standalone ones, and leave them for a month. Then stand at the spot where your last sensor pilot lost its signal and note what you can see: a tower, a pole, a ridge, a canal berm. That one page of notes is the start of the design.
About Fireball Industries
Fireball Industries is EmberNet’s master integrator and the builder of Project Horsepower. Fireball designs, builds, and supports networks like the one in this paper, from pump-station panels and solar field nodes to tower sites, grower domains, and the Plow Horse farm twin.
Sources
- USDA National Agricultural Statistics Service. “2023 Irrigation and Water Management data now available.” October 31, 2024. https://www.nass.usda.gov/Newsroom/2024/10-31-2024.php
- USDA National Agricultural Statistics Service. “2022 Census of Agriculture Highlights: Irrigation and Water Management” (2023 Irrigation and Water Management Survey). October 2024. https://www.nass.usda.gov/Publications/Highlights/2024/Census22_HL_Irrigation_4.pdf
- USDA National Agricultural Statistics Service. “2023 Irrigation and Water Management Survey, Energy Expenses for Pumps by Energy Source.” 2022 Census of Agriculture online resources, 2024. https://www.nass.usda.gov/Publications/AgCensus/2022/Online_Resources/Farm_and_Ranch_Irrigation_Survey/fris_1_016_016.pdf
- US Department of Energy, Advanced Manufacturing Office. “Eliminate Voltage Unbalance,” Motor Systems Tip Sheet #7. November 2012. https://docs.nlr.gov/docs/fy13osti/56005.pdf
- Scherer, T. F., NDSU Extension. “Irrigation Water Pumps” (AE1057). Reviewed February 2022. https://www.ndsu.edu/agriculture/extension/publications/irrigation-water-pumps
- Ziolkowska, J. R. “Economic value of environmental and weather information for agricultural decisions: A case study for Oklahoma Mesonet.” Agriculture, Ecosystems and Environment 265 (2018): 503 to 512. https://www.sciencedirect.com/science/article/abs/pii/S0167880918302810
- Semtech. “LoRa and LoRaWAN: A Technical Overview.” Accessed September 2026. https://www.semtech.com/uploads/technology/LoRa/lora-and-lorawan.pdf
- LoRa Alliance. “LoRaWAN 1.0.3 Specification.” 2018. https://lora-alliance.org/wp-content/uploads/2020/11/lorawan1.0.3.pdf
- SmartMakers. “LoRaWAN Range, Part 2: Range and Coverage of LoRaWAN in Practice.” April 1, 2019. https://smartmakers.io/en/lorawan-range-part-2-range-and-coverage-of-lorawan-in-practice/
- Wi-Fi Alliance. “Wi-Fi CERTIFIED HaLow.” Accessed September 2026. https://www.wi-fi.org/discover-wi-fi/wi-fi-certified-halow
- Wikipedia. “IEEE 802.11ah.” Accessed September 2026. https://en.wikipedia.org/wiki/IEEE_802.11ah
- Morse Micro (vendor). “Pushing the Limits: Wi-Fi HaLow Testing in Joshua Tree National Park.” September 2024. https://www.morsemicro.com/news/pushing-the-limits-wi-fi-halow-testing-in-joshua-tree-national-park
- Hetting, C., Wi-Fi NOW. “Wi-Fi HaLow update 08/25: Revisiting distance records.” August 10, 2025. https://wifinowglobal.com/news-blog/wi-fi-halow-update-08-25-revisiting-distance-records-morse-micro-wins-award-more-halow-products-released/
- Electronic Code of Federal Regulations. “47 CFR 96.41, General radio requirements.” Accessed September 2026. https://www.ecfr.gov/current/title-47/chapter-I/subchapter-D/part-96/subpart-B/section-96.41
- Wikipedia. “Citizens Broadband Radio Service.” Accessed September 2026. https://en.wikipedia.org/wiki/Citizens_Broadband_Radio_Service
- Zhivkov, T., Sklar, E. I., Botting, D., and Pearson, S. “5G on the Farm: Evaluating Wireless Network Capabilities and Needs for Agricultural Robotics.” Machines 11, no. 12 (2023): 1064. https://www.mdpi.com/2075-1702/11/12/1064
- US Department of Agriculture. “Broadband.” Accessed September 2026. https://www.usda.gov/sustainability/infrastructure/broadband
- Wikipedia. “Electrolytic capacitor” (lifetime and temperature). Accessed September 2026. https://en.wikipedia.org/wiki/Electrolytic_capacitor
- Math Sci Notes. “Outdoor Enclosure Temperature Profile Math.” December 9, 2012. https://www.mathscinotes.com/2012/12/outdoor-enclosure-temperature-profile-math/
- DuPont, T., and Ford, T., Penn State Extension. “Keeping Produce Fresh: Best Practices for Producers.” Updated July 31, 2017. https://extension.psu.edu/keeping-produce-fresh-best-practices-for-producers/
- NC State Extension. “Chapter 3d. Vacuum Cooling,” Introduction to the Postharvest Engineering for Fresh Fruits and Vegetables. May 1, 2025. https://content.ces.ncsu.edu/introduction-to-the-postharvest-engineering-for-fresh-fruits-and-vegetables/3d-vacuum-cooling
- Ag Data Transparent. “Core Principles (2014): Privacy and Security Principles for Farm Data.” Accessed September 2026. https://www.agdatatransparent.com/core-principles-2014
- Stouffer, K., et al., National Institute of Standards and Technology. “SP 800-82 Rev. 3, Guide to Operational Technology (OT) Security.” September 2023. https://csrc.nist.gov/pubs/sp/800/82/r3/final