

It is the third coil after a work roll change. The head end comes out of the roughing mill a little cold on the operator side, threads F1 and F2, and the looper between F3 and F4 swings to its upper limit and back. F5 bites late. By the time the operator’s hand reaches the stop, the finishing mill is full of folded strip, the entry guides on F6 are bent, and the crew is reaching for torches. The cobble itself took less than two seconds. Clearing it, inspecting the stands, changing damaged rolls, and rethreading will take most of the shift.
The next morning brings the same meeting most mills hold. The process engineer has a level 2 coil report with setup values and a gauge trace. Maintenance has a drive fault log with timestamps from a different clock. Somebody pulls the high-speed data acquisition files if they were armed and kept, and somebody else remembers that the looper on that stand has been “a little lively” since the last outage. Everyone has a piece of the event. Nobody has the whole thing, at the resolution it happened, in one place.
This paper is about building that one place: a record of thickness, tension, speed, roll force, and drive torque across every stand, captured at the rate the mill actually moves, available to the people who have to explain and prevent the next wreck, and walled off so that reaching it from the office never means the office can reach the mill. Most of it can be done with equipment and signals the mill already has. The parts that need new hardware are few and specific.
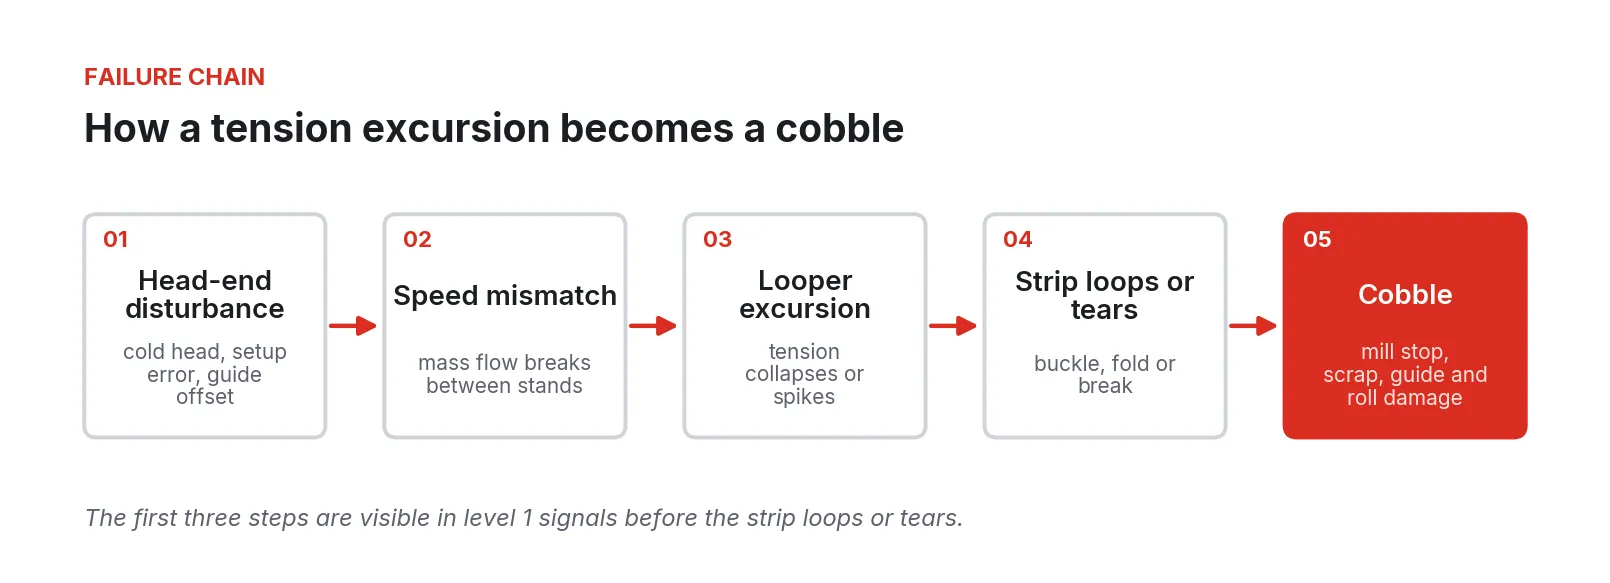
Figure 1. The failure chain behind most finishing-mill cobbles. The early steps show up in level 1 signals before the strip loops or tears.
Why this is worth a shift’s attention
The direct numbers are large and the indirect ones are larger. Siemens’ 2024 survey of large manufacturers puts the annual cost of unplanned downtime for an average heavy-industry plant at $59 million, 1.6 times the 2019 figure, and finds the cost of a lost hour in heavy industry roughly quadrupled over the same period. The same report found heavy-industry plants had cut the number of downtime hours sharply, which means each remaining hour carries more of the bill [1][2].
Cobbles are where a rolling mill loses those hours fastest. A study at a merchant bar mill observed two to four cobbles per rolling day, each one tripping the mill [3]. In a hot strip mill study published in the Journal of Iron and Steel Research International, a correlation analysis showed cobbles, ahead of scale loss, were the main contributor to yield loss; the mill set a target of single-digit cobbles per month and recovered 0.93% of yield by attacking them [4]. One maintenance-software vendor’s estimate puts the direct equipment damage from a single strip-mill cobble at $150,000 to $500,000 before lost production is counted; it is a vendor figure, but a useful order of magnitude for a mill that has never costed its own wrecks [5].
Gauge is the other half of the cost. EN 10051 allows ±0.21 mm on 2.0 to 2.5 mm hot-rolled strip between 1,200 and 1,500 mm wide, for the basic steel category [6], and customers routinely buy tighter than the standard: one European producer publishes guaranteed thickness classes at a fraction of the EN 10051 band [7]. ASTM A568 sets the North American defaults and measures thickness a fixed distance in from the edge because edge fall-off is a natural product of rolling [8]. Off-gauge head ends, tail ends, and mid-coil excursions become downgrades, cut-backs, and claims. Every one of them was visible in the mill signals while it was happening.
Figure 2. Downtime, cobble, and gauge figures from the sources cited in this paper: Siemens [1], Dewangan et al. [3], and the BSSA summary of EN 10051 [6].
A self-check for your mill
Try to answer these about your own line, today, without calling anyone.
- For the last cobble in the finishing mill or the intermediate stands, can you lay the looper angles, interstand tensions, stand speeds, roll forces, and main drive torques on one time axis at 10 ms or better, starting five seconds before the stop?
- Is your high-speed data acquisition armed on every stand all the time, or only when someone is chasing a problem? How long is the data kept, and who can find it?
- When the X-ray gauge reports an excursion, can you tell within a minute whether it came from the stand (HGC position, roll force, bending), from tension, from temperature, or from the setup?
- Do you know the actual service tonnage and condition at removal of the last fifty work rolls on F5 and F6, and how that compares to the wear model’s prediction?
- Do you trend main drive torque peaks at bite, and spindle or gearbox vibration, per stand, per coil?
- Can a laptop on the business network open a session to a level 2 server or a stand PLC? Can a vendor’s remote support connection? Who would know if one did last night?
- If a level 2 server failed tonight, how many of its signals would you lose permanently?
Most mills answer two or three of these well. The rest of this paper is a way to answer all seven.
What needs to be measured, and from where
The signals below already exist in nearly every strip mill. The work is collecting them at the right rate, with one clock, from the right source.
| Signal | Typical source | Rate that matters | Why it matters |
|---|---|---|---|
| Exit thickness, centerline | X-ray or isotope gauge after the last stand | 1 to 10 ms | Ground truth for AGC and for every gauge claim |
| Profile and crown | Scanning gauge, profile gauge | Per scan | Crown drift points to roll wear, bending, or thermal camber |
| Flatness / shape | Shape roll or optical flatness meter | 10 to 50 ms | Edge wave and center buckle; feedback to bending and cooling |
| Roll force, per side | Load cells, HGC pressure transducers | 1 to 2 ms | Mill stretch, tilt, gaugemeter thickness, bite detection |
| HGC cylinder position | Position transducers, stand PLC | 1 to 2 ms | Gap control response; servo valve health |
| Looper angle and torque | Looper drive and position sensor | 2 to 5 ms | Interstand tension and mass flow balance |
| Interstand tension | Tensiometer roll or calculated from looper torque | 2 to 5 ms | Thickness and width stability; cobble precursor |
| Stand speed reference and actual | Main drive, speed master | 1 to 2 ms | Mass flow, speed cone, threading |
| Main drive torque and current | Drive controller | 1 ms | Bite impact, torque amplification, overload |
| Spindle and gearbox condition | Vibration, temperature, oil analysis | Continuous / per coil | Backlash, coupling wear, bearing failure |
| Strip temperature | Pyrometers at roughing exit, finishing entry and exit | 10 to 50 ms | Head-end temperature drop feeds bite and cobble risk |
| Setup and schedule | Level 2 | Per coil | What the model asked for, to compare against what happened |
A few notes on the rows that cause the most trouble.
Thickness. The exit gauge sits downstream of the last stand; one published study of a seven-stand finishing mill locates it 3.72 m after F7, which is why monitor AGC loops need dead-time compensation such as a Smith predictor [9]. That transport delay matters for data collection too. If gauge data and stand data are logged on different clocks, or at different rates, the excursion appears to precede its cause. Record the gauge and the stands on one time base, and shift the gauge trace by strip speed when analyzing. One gauge maker’s comparison gives X-ray gauge update rates of 1 to 10 ms [10]; that is the rate the rest of the record has to match.
Tension. Looper-tension control is strongly coupled to thickness. A 2025 study in Machines notes that strip velocity between stands is generally not measured directly and has to be inferred from roll speed and forward slip, which carries uncertainty into the tension loop and from there into gauge [11]. Practical consequence: log looper angle, looper torque, both adjacent stand speeds, and the calculated tension together. Any one of them alone will mislead you.
Drive torque. Main drive torque is where mechanical damage starts. A 2024 study on a 5,000 mm plate mill reports dynamic torque overloads at bite that exceed rated motor torque by many times, driving fatigue failures in spindle joints and roll breakage; the authors’ strain-gauge telemetry measured spindle torque within ±5% and supported a drive acceleration strategy that cut dynamic spindle loads by 1.3 to 1.5 times [12]. Even without spindle telemetry, drive torque sampled at 1 ms shows the bite impact; at 100 ms the peak falls between samples.
Speed and mass flow. In long-product mills the same physics applies without a looper to absorb it. Too much tension necks the bar and can pull it apart; compression between stands grows a loop that ends in a cobble. Speed matching for constant mass flow is the main defense [13]. Wire rod blocks run near 120 m/s, so a speed mismatch becomes a cobble in milliseconds [13].
A reference architecture
The architecture has one job: get every signal above off the mill at full resolution, keep it, and make it available upward, without ever giving anything upstream a path back down to level 1.
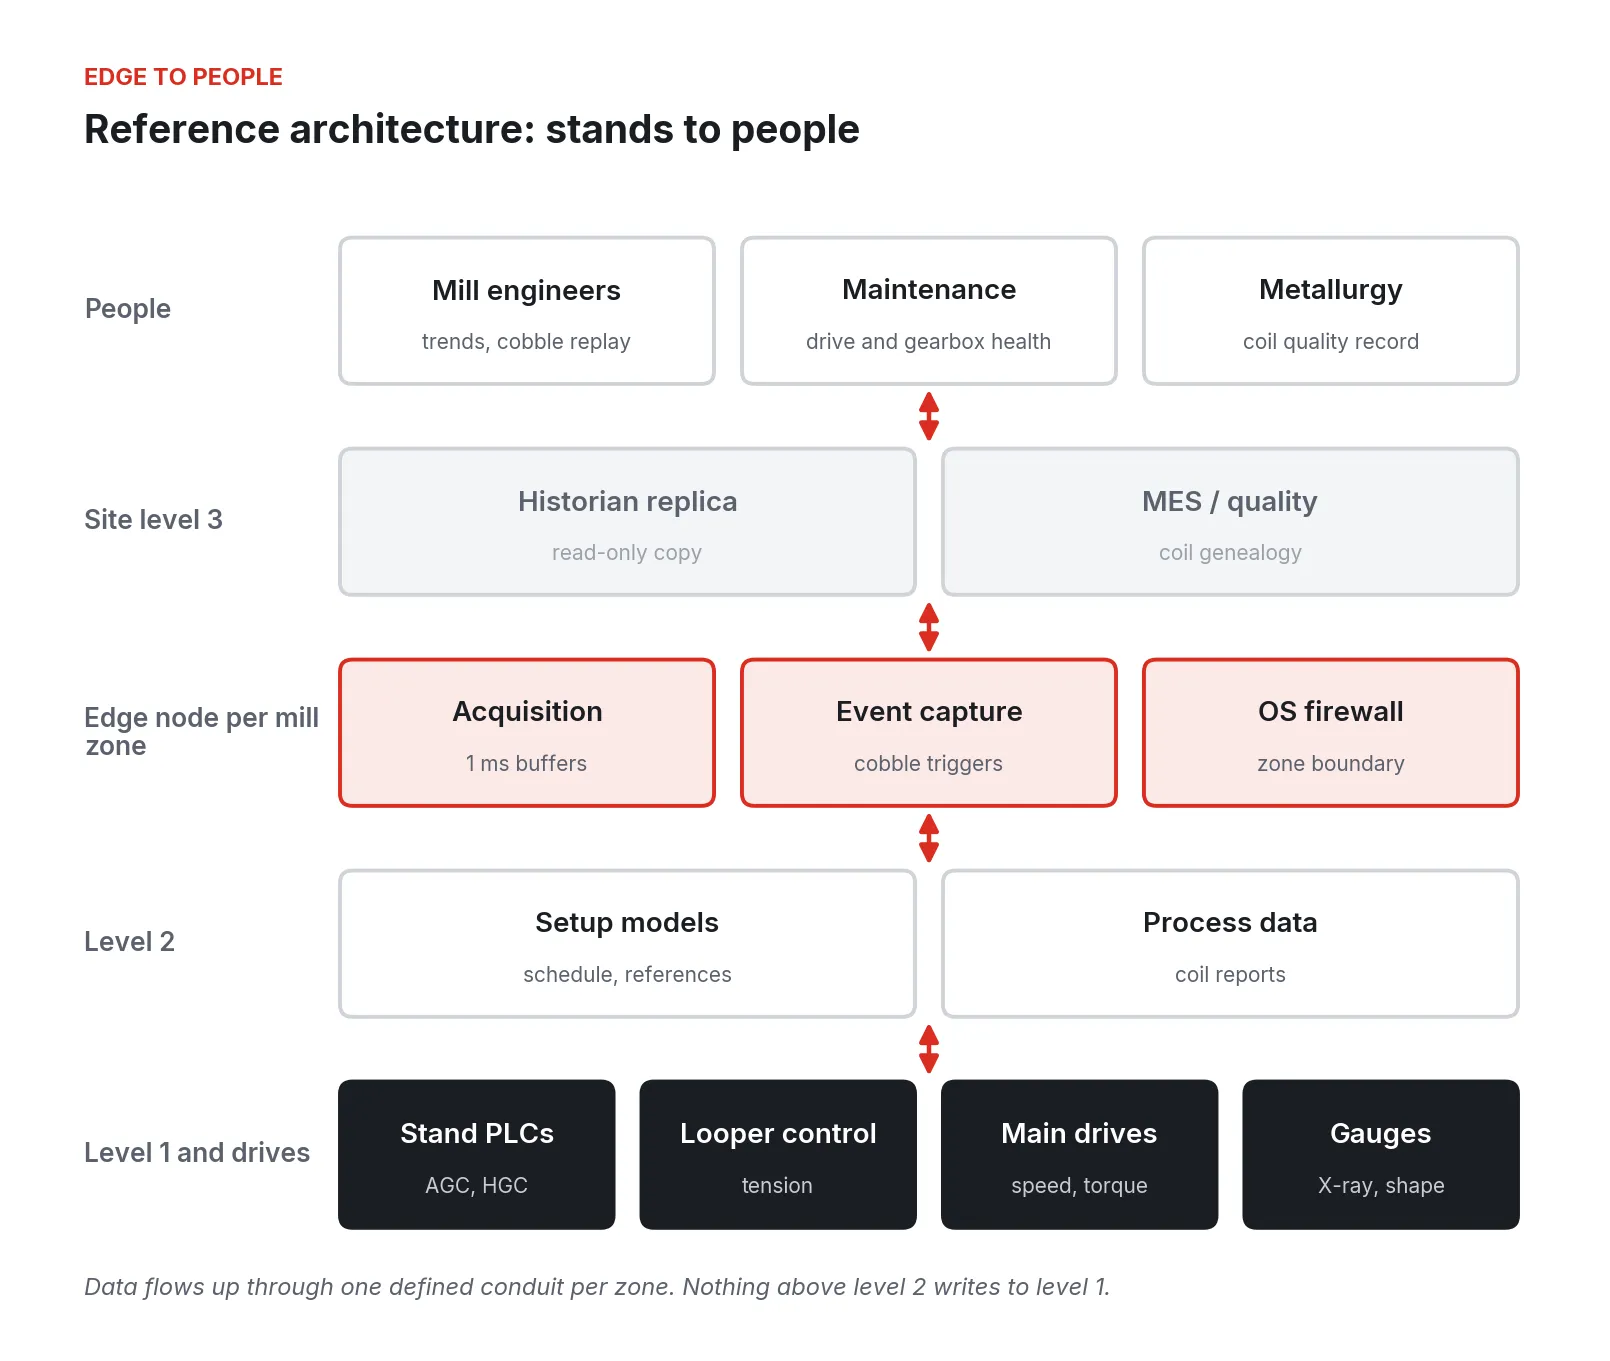
Figure 3. Reference architecture. Level 1 controllers and drives keep running as they are; an edge node per mill zone acquires, buffers, captures events, and enforces the zone boundary. People reach a read-only replica.
Read the figure from the bottom.
-
Level 1 and drives stay as they are. Stand PLCs running AGC and HGC, looper controllers, main drives, and gauges keep their logic, their networks, and their tuning. Nothing in this architecture writes to them.
-
Level 2 keeps its job. Setup models, schedule handling, and coil reporting are untouched. Level 2 is a source for setup and coil identity, and a consumer of nothing new.
-
An edge node per mill zone. One for the roughing mill and transfer, one for the finishing mill, one for the coilers, as a starting division. Each node reads the zone’s level 1 and drive data at millisecond rates over the protocols the equipment already speaks, timestamps everything against one clock, keeps a rolling buffer of several days at full resolution, and saves a full-resolution window around any trigger: mill stop, looper limit, torque limit, gauge excursion.
-
Downsampled data and events move up. Per-coil summaries, trends at 100 ms or one second, and the captured event windows go to a historian replica and the quality system. Engineers, maintenance, and metallurgists work from the replica.
-
The boundary is enforced on the node. The node is the only device in the zone with a path out, and that path is outbound only.
The node does not need to be exotic. What matters is that the acquisition task is never starved by something else running on the same box, that the buffer survives a power cycle, and that the node can be patched without anyone driving to the mill. Several of the components most mills would want here are ordinary software: a time-series database, a dashboard, an MQTT broker, an existing high-speed acquisition package, an Ignition or CODESYS gateway. They can share one industrial PC per zone as long as they are isolated from each other.
Walking the line, cheapest fixes first
The order below puts the work that costs least and returns most at the front.
1. Read the cobble log you already have
Before any hardware, pull the last twelve months of mill delays and classify every cobble by stand, product, thickness, width, time since roll change, and stated cause. A hot strip mill study published in 2026 found thickness deviation was the strongest single process contributor to cobbles, with temperature and width variation behind it, and concluded that cobbles come from accumulated instability across several conditions rather than one parameter [14]. Your own log will show which stands and products to instrument first. It costs a week of an engineer’s time.
2. Arm the acquisition you already own
Many mills own a high-speed data acquisition system that is licensed for more signals than it records, or that only runs when someone arms it. One common package, per its vendor, samples up to 100 kHz per channel and is licensed from 64 signals up [15]. Configure it to record every finishing stand’s force, position, speed, torque, and looper signals continuously into a ring buffer, and to save a window on every mill stop. Name the files by coil ID. This step needs engineering time and no capital.
3. Put the gauge and the stands on one clock
Check whether the gauge, the level 1 PLCs, the drives, and level 2 share a time source. Often they do not. A common time base, and a coil ID carried with every record, are the two changes that make a cobble review possible in an hour instead of a day.
4. Watch the drive train per coil
Add per-coil peak torque at bite for each main drive, time to recover speed after bite, and gearbox and spindle vibration where sensors exist. Trend them by stand over months. Torque amplification at bite grows as spindle and coupling clearances open up [12], so a slow upward drift in bite peaks on one stand is a maintenance signal weeks before a coupling lets go. Where the damage history justifies it, spindle torque telemetry measures the real shaft load rather than inferring it from the motor [12].
5. Close the loop on roll wear
Record actual tonnage, kilometers, product mix, and measured wear for every work roll at removal, and compare against the wear model in level 2. In one U.S. Steel study published by AIST, the original wear model underestimated wear on heavy-gauge products by 35 to 50%; excessive wear on the last roughing stand changed transfer bar crown, narrowed width through the finishing mill, and produced a cobble when the bar buckled [16]. A separate study of finishing stands F5 and F6 attributed about 30% of roll reconditioning to inappropriate use rather than normal wear [17]. Roll change intervals tied to measured wear and observed shape and crown drift beat a fixed schedule.
6. Use the data for gauge, not only for wrecks
Once force, gap position, tension, and gauge sit on one time base, gauge excursions can be split into causes. Published HGC work on a hot mill showed thickness held within ±0.06 mm against a ±0.1 to 0.3 mm target once mill stretch and controller gains were addressed, and notes that mill stretch can reach a couple of millimeters under load, which is why the mill modulus has to be measured accurately [18]. Another study found AGC hit rates dropping sharply above 6 mm and replaced a single fixed gain with gain scheduling by deviation size [9]. Neither change is possible to justify without the data to show where the error comes from. A TMEIC article in Iron & Steel Technology describes anomaly detection on roll force, motor current, and strip tension, and clustering about 730 coils into 12 behavior patterns [19]; all of it starts from the same record.
7. Then think about control
Once the record exists, it tells you whether the problem on a given stand is tuning, mechanics, or setup, and what supervisory logic or model change belongs on top.
Where these projects go wrong
-
Sampling too slowly. A historian polling at one second records that a cobble happened. It cannot show why. Bite events, looper swings, and torque peaks happen in tens of milliseconds. Collect at the rate of the signal and downsample above the edge, never below it.
-
Polling the PLC from the enterprise side. A historian or an analytics tool reaching across the IT/OT boundary to poll stand PLCs puts load on controllers that are running AGC and adds a path from the office into level 1. Collection belongs inside the zone.
-
Clocks that disagree. Gauge, drive, PLC, and level 2 timestamps that differ by hundreds of milliseconds make every cause look like an effect. Fix the time base before building any analysis.
-
Recording without coil identity. Data that cannot be tied to a coil ID, grade, and schedule position cannot be compared across coils, and comparison across coils is where most of the value is.
-
Arming on demand. Acquisition that someone has to remember to start misses the event that matters. Continuous ring buffers with triggered saves are the fix.
-
Treating models as truth. The roll wear and setup models are good and still miss; the AIST study above found a 35 to 50% underestimate on heavy gauge [16]. Store what the model predicted beside what happened.
-
Overloading one box. Dashboards, analytics, and acquisition on one unmanaged PC means a browser tab can cost you a cobble window. Isolate acquisition from everything else on the node.
-
Remote access added later. The first time a drive vendor needs to look at a fault, someone opens a firewall rule or plugs in a cellular modem. Plan the vendor access path at the start.
Security: fencing the mill off from the office
Rolling mills are a proven target. Germany’s Federal Office for Information Security reported in 2014 that attackers used spear phishing and social engineering to gain access to a German steel works’ office network, worked their way into production networks, and caused failures of individual control components and whole plants; a blast furnace could not be shut down in a controlled way, and the plant suffered massive damage [20]. The path in that case is the path most mills still have: business network to level 2 to level 1.
ISA/IEC 62443 frames the answer as zones and conduits. A zone groups systems with common security requirements by their functional, logical, and physical relationship; a conduit is the defined set of communication channels between zones, and each zone and conduit gets a target security level from risk assessment [21][22]. NIST SP 800-82 Rev. 3 gives the same structure for operational technology in U.S. federal terms and adds guidance on defense in depth, remote access and patching of OT systems [23]. Neither document certifies a product into compliance. The mill’s own security program sets the zones, the target levels, and the evidence.
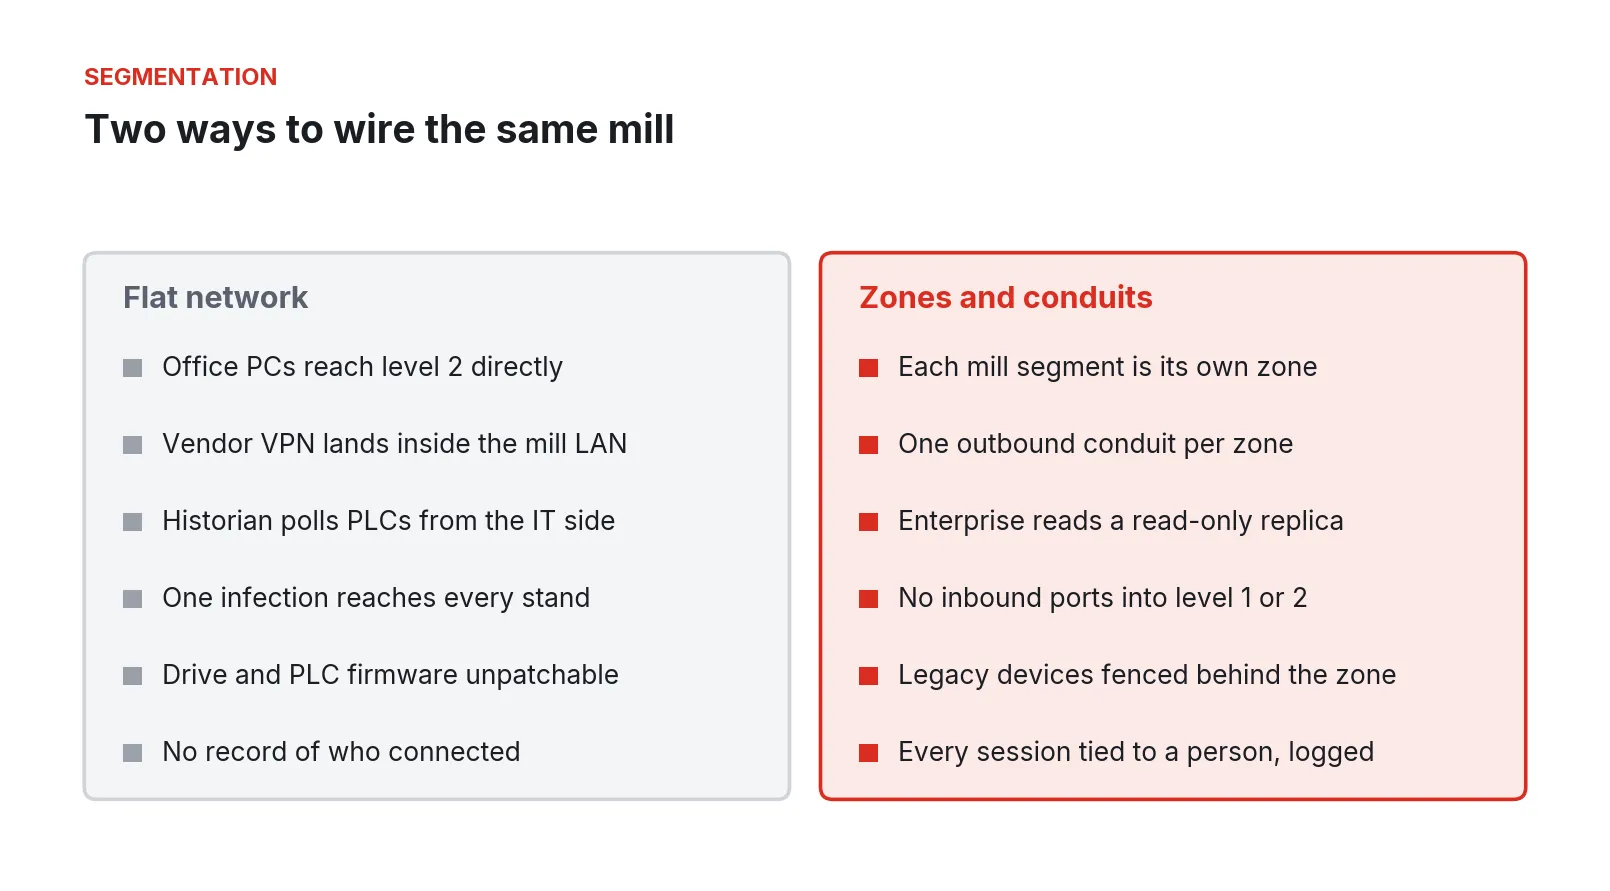
Figure 4. A flat mill network compared with a zone-and-conduit design. The signals collected are the same; the paths into level 1 differ.
Mapped onto a rolling mill, the controls look like this.
-
Zones by mill segment. Reheat furnaces, roughing mill, finishing mill, run-out table and coilers, and each cold mill or processing line, become separate zones. A compromise in the coiler zone should not reach the finishing stands.
-
Level 1 inside, level 2 at the boundary, level 3 outside. Level 2 setup servers talk down to their own zone’s level 1 and up through one conduit. Business systems never address a stand PLC.
-
One conduit per zone, outbound only. Data leaves the zone through the edge node. No inbound connection is opened from the enterprise or the internet into level 1 or level 2.
-
Read-only replicas for the business side. Engineers on the office network read a historian replica, not the live controllers.
-
Legacy devices fenced behind the zone. Old drives and PLCs that cannot be patched sit behind the zone boundary with no route to anything outside it.
-
Named, logged remote sessions. Every vendor and engineer session is tied to a person and recorded, with no shared VPN accounts.
-
Patchable, recoverable edge devices. The device that enforces the boundary has to be patched more often than the PLCs it protects, and a bad patch has to be reversible.
A phased rollout
The phases below start with one mill and one zone. Each phase produces something useful even if the next one never happens.
Figure 5. Phased rollout from a single-zone assessment to full-line coverage. Durations are illustrative and depend on outage windows.
-
Weeks 1 to 4: assess one mill. Classify a year of cobbles and gauge claims. Build the signal list in the table above for one zone, with source, protocol, and current recording rate. Draw the real network, including every remote access path.
-
Weeks 5 to 10: instrument one zone. Usually the finishing mill. Install the edge node, collect at full rate on one clock, add coil identity, set the event triggers, and run the first cobble reviews from the record.
-
Weeks 11 to 16: fence the zone. Move remote access to the outbound-only path, close inbound rules, put the business side on the replica, and turn on session logging.
-
Months 5 to 9: extend down the line. Roughing, coilers, and drives, then cold mills or long-product lines on the same pattern.
-
Ongoing: use the record. Weekly cobble and gauge reviews from the data, roll wear compared against prediction, drive health trended per stand.
What to do Monday
Pull the delay log for the last year and count your cobbles by stand. Pick the stand pair with the most. Find out whether your high-speed acquisition is recording those two stands right now, at what rate, on which clock, and for how long it keeps the data. Then ask IT to show you every network path from the business side to that stand’s PLC and to its level 2 server. Write both answers on one page. That page is your project scope. Most of it can be done with what the mill already owns.
Fireball Industries is EmberNet’s master integrator. Fireball’s engineers have upgraded steel mill PLC and HMI controls, and Fireball designs, builds, and supports rolling line monitoring of this kind: signal surveys, edge nodes in front of existing stand controllers and drives, zone and conduit segmentation, and the phased migration of controllers when the time comes.
Sources
- Siemens / Senseye, “The True Cost of Downtime 2024,” 2024. https://assets.new.siemens.com/siemens/assets/api/uuid:1b43afb5-2d07-47f7-9eb7-893fe7d0bc59/TCOD-2024_original.pdf
- Thomas Wilk, Plant Services, “Maintenance Mindset: Inflation-driven trends are causing unplanned downtime costs to surge 300% in heavy industry,” August 6, 2025. https://www.plantservices.com/predictive-maintenance/article/55308021/maintenance-mindset-inflation-driven-trends-are-causing-unplanned-downtime-costs-to-surge-300-in-heavy-industry
- S. Dewangan, C. Verma, S. K. Dewangan, “Production Analysis by Modelling of Unfinished Product Generation in Rolling Mill of Steel Industry,” Shri Shankaracharya Engineering College (paper, undated). https://pdfs.semanticscholar.org/53d3/ba59f1ca8d81bc5b5394f8acecdc126387f1.pdf
- K. Chakravarty, “Improvement in Production Yield of Hot-rolled Coil by Controlling Process Cobbles,” Journal of Iron and Steel Research International, October 2016. https://link.springer.com/article/10.1016/S1006-706X(16)30155-8
- OxMaint (maintenance software vendor), J. Smith, “Cobble Detection and Prevention in Rolling Mills,” April 24, 2026. https://oxmaint.com/industries/steel-plant/cobble-detection-prevention-rolling-mills-guide
- British Stainless Steel Association, “Tolerances to EN 10051 for continuously rolled hot rolled plate, sheet and strip,” undated. https://bssa.org.uk/bssa_articles/tolerances-to-en-10051-for-continuously-rolled-hot-rolled-plate-sheet-and-strip/
- voestalpine (steel producer), “Thickness tolerances, hot-rolled strip,” December 2024. https://www.voestalpine.com/ultralights/en/content/download/32076/file/Thickness-tolerances-hot-rolled-strip-voestalpine-EN.pdf
- ASTM International, Standardization News, “Steel Sheet Thickness Tolerances” (A568/A568M), March/April 2010. https://www.astm.org/news/steel-sheet-thickness-tolerances-ma10
- X. Zhang, F. Wang, Z. Liu, J. Fan, X. Huang, “Research on Intelligence of AGC System in Hot Strip Mill,” MEEES 2018, Atlantis Press, 2018. https://www.atlantis-press.com/article/25898849.pdf
- KY Automation (gauge vendor), “Contact vs. Laser vs. X-Ray Thickness Measurement Technologies for Cold Rolling Mill Gauge Control,” June 29, 2026. https://www.kyautomation.com/news/3619.html
- Y.-C. Huang, C.-C. Peng, “Rolling Mill Looper-Tension Control for Suppression of Strip Thickness Deviation by Adaptive PI Controller with Uncertain Forward/Backward Slip,” Machines (MDPI), March 2025. https://www.mdpi.com/2075-1702/13/3/238
- S. S. Voronin et al., “Telemetry System to Monitor Elastic Torque on Rolling Stand Spindles,” Journal of Manufacturing and Materials Processing (MDPI), 2024. https://www.mdpi.com/2504-4494/8/3/85
- Satyendra, IspatGuru, “Understanding Rolling Process in Long Product Rolling Mill,” November 27, 2015. https://www.ispatguru.com/understanding-rolling-process-in-long-product-rolling-mill/
- M. Ajay Kumar, C. Hiregoudar, “Hot Strip Mill Process Flow, Cobble Generation & Preventive Action,” International Journal of Engineering Research & Technology, July 14, 2026. https://www.ijert.org/hot-strip-mill-process-flow-cobble-generation-preventive-action-ijertv15is070184
- iba AG (data acquisition vendor), “ibaPDA,” product page, accessed September 2026. https://www.iba-ag.com/en/ibapda
- E. Nikitenko, U.S. Steel Research and Technology Center, “Improving the Accuracy of Predicting Work Roll Wear in the Hot Strip Mill,” Iron & Steel Technology (AIST), November 2017. https://www.aist.org/AIST/aist/AIST/Social_Media/17_nov_40_44_Improving_Accuracy.pdf
- M. Niekurzak, E. Kubińska-Jabcoń, “Assessment of the Impact of Wear of the Working Surface of Rolls on the Reduction of Energy and Environmental Demand for the Production of Flat Products: Methodological Approach,” Materials (MDPI), March 21, 2022. https://www.mdpi.com/1996-1944/15/6/2334
- P. Kucsera, Z. Béres, “Hot Rolling Mill Hydraulic Gap Control (HGC) Thickness Control Improvement,” Acta Polytechnica Hungarica, 2015. https://acta.uni-obuda.hu/Kucsera_Beres_62.pdf
- G. Gepitulan, J. McMillen, P. Jackson, J. Hollingsworth (TMEIC), “Digital Solutions for the Hot Strip Mill: Leveraging Industry 4.0,” Iron & Steel Technology (AIST), March 2024. https://www.aist.org/AIST/aist/AIST/Publications/images/24_March_042-049_digtrans.pdf
- Bundesamt für Sicherheit in der Informationstechnik (BSI), “Die Lage der IT-Sicherheit in Deutschland 2014,” section 3.3.1, December 2014. https://www.bsi.bund.de/SharedDocs/Downloads/DE/BSI/Publikationen/Lageberichte/Lagebericht2014.pdf
- International Society of Automation, “ISA/IEC 62443 Series of Standards,” accessed September 2026. https://www.isa.org/standards-and-publications/isa-standards/isa-iec-62443-series-of-standards
- Dragos, “Understanding ISA/IEC 62443: A Guide for OT Security Teams,” January 8, 2025. https://www.dragos.com/blog/isa-iec-62443-concepts
- K. Stouffer et al., NIST, “Guide to Operational Technology (OT) Security,” SP 800-82 Rev. 3, September 2023. https://csrc.nist.gov/pubs/sp/800/82/r3/final