

It is 3 a.m. and the kiln has been drifting for an hour. The RDF feeder is pulling a wetter batch than the one before it, kiln inlet O2 has slid under 2 percent, and CO is spiking at the inlet analyzer every few minutes. The burning zone pyrometer reads hot, but kiln drive torque is falling, which says the load is getting lighter and the coating is changing. The last free lime result is two and a half hours old. The operator does what experienced operators do: cuts the alternative fuel, adds coal, opens the ID fan a little, and waits. The kiln comes back, and the shift report records a stable night. It doesn’t record the extra coal or the sulfur now settling in the bottom-stage cyclone.
Fuel is the largest controllable cost in a cement plant. Energy accounts for 20 to 40 percent of cement production cost, according to the ENERGY STAR guide for the industry [4]. The world average for clinker is about 3.6 GJ of heat per tonne [1], against roughly 3.3 GJ/t for the best preheater-precalciner kilns [2], and GCCA member data show the average barely moved after 2012 [3]. Part of that gap comes from how the kiln is run hour to hour: excess air carried, burning zone held hot, coal added to cover for alternative fuel. Process control in the kiln typically saves 2.5 to 5 percent of energy, with paybacks of two years or less [4].
Many plants already own an optimizer that spends much of its time switched off. This paper covers why, which signals a kiln optimizer needs, how to run one next to the kiln, and how to roll it out so the control room keeps using it.
Figure 1. Key figures for kiln energy and control. Sources: IEA (2023), Worrell et al. for ENERGY STAR (2013), Fuller Technologies (2026).
A self-check for your kiln line
Answer from records, not memory.
- What was your specific heat consumption, in MJ or kcal per kg of clinker, for each of the last twelve months? How wide was the spread between your best and worst week?
- How many hours last month did your kiln optimizer or expert system actually run in automatic? Who switched it off, and do you have a record of why?
- How often is free lime sampled, how long does the result take to reach the control room, and how many results last month fell outside your target band?
- How many hours last month was the kiln inlet gas analyzer out of service for probe cleaning, blockage, or calibration? Did the operators trust its readings the rest of the time?
- How many kiln stops last year began with a cyclone blockage, a ring, or a shell hot spot? For each one, could you have seen it coming in the data you already collect?
- At what alternative fuel substitution rate does your kiln start to misbehave, and is that limit written down anywhere, or does it only live with your best operator?
- When your CEMS shows a NOx or SO2 excursion, can you line it up second by second with burner, fuel, and draft changes? Or do you get hourly averages from a separate system?
Why kiln optimizers end up switched off
The kiln is a hard process to control. A 2023 review in the Journal of Process Control lists the reasons: long time constants and dead time, uncertain raw material properties, tightly coupled variables, alternative fuels that change how efficiently heat goes in, and operating points that keep moving [10]. Feed takes many minutes to travel from the preheater to the cooler, and free lime, the main measure of clinker quality, is usually a lab result. One field study of a kiln APC reports free lime analysis four times a day [9]. A vendor presentation puts lab turnaround for free lime and clinker phases at two to four hours [5]. When expert systems and MPC run, they work. The ENERGY STAR guide reports typical energy savings of 3 to 8 percent from expert systems and fuzzy logic, and a 4 percent reduction from model predictive control on a South African kiln [4]. Vendor case studies report the same pattern: one vendor reports a 27 percent reduction in free lime variation and a 4 percent average production increase at a Brazilian plant [6]; another reports heat consumption falling from 845 to 823 kcal/kg clinker on a kiln using four signals: sintering zone temperature, kiln inlet temperature, kiln inlet O2, and kiln inlet NOx [8].
The systems get switched off for reasons operators will recognize:
-
The controller is a black box. When operators can’t see what the controller is doing and why, they go back to manual, and the benefit goes with them. A vendor that builds these controllers says this plainly [5].
-
The models go stale. One vendor’s own review of conventional systems says fuzzy logic does not cover all operating scenarios and is very sensitive to operational changes, and linear MPC models need retuning whenever equipment changes [8]. A new burner, a different coal, or a third alternative fuel line can leave the model behind the plant.
-
The inputs are bad. The optimizer leans on the kiln inlet analyzer, which lives in one of the dirtiest locations in the plant. When the probe is blocked or in a cleaning cycle and the controller keeps acting on the reading, the operators learn to take it off.
-
Alternative fuels arrive faster than the model can learn them. An ABB paper on alternative fuels notes that their heat content is often updated only monthly, that conveyor transport delays reach many minutes, and that substitution above about 30 percent creates serious control problems [7].
-
Operators carry margin. A vendor paper on kiln AI observes that operators set fuel rate at a level they are comfortable with, based on their experience, which keeps fuel consumption high [8]. That is a rational choice when the penalty for a cold kiln is a stop and the reward for saving fuel is invisible.
Each of these is a design requirement. An optimizer that explains itself, keeps working when an analyzer drops out, retrains when the fuel mix changes, and lets the operator accept, limit, or hold its moves is one that stays on.
What needs to be measured
A kiln optimizer is only as good as the signals it reads. Most of them already exist on the DCS. The work is getting them to one place at a fast, consistent sample rate, with their quality status attached.
| Area | Signal | Source | Why it matters |
|---|---|---|---|
| Burning zone | Burning zone temperature (pyrometer or camera), NOx at kiln inlet | Pyrometer, burner camera, inlet analyzer | Inlet NOx tracks flame temperature and is often the steadiest indirect reading of the burning zone [8] |
| Burning zone | Kiln drive torque or amps, kiln speed | Drive (VFD or DC drive) | Torque rises with a hotter, stickier load and falls as the kiln cools or coating breaks |
| Kiln inlet | O2, CO, NOx; inlet temperature | Extractive gas analyzer, thermocouple | Combustion completeness, sulfur volatility, and build-up risk [11][12] |
| Preheater | Cyclone cone drafts and temperatures, stage outlet temperatures, riser pressure | Pressure transmitters, thermocouples | First sign of a cyclone build-up or blockage [12] |
| Calciner | Calciner outlet temperature, tertiary air, O2/CO at preheater exit | Thermocouples, analyzer | Degree of calcination; the main control variable for calciner fuel [7] |
| Draft | ID fan speed and power, exit gas O2 | Drive, analyzer | Total air and false air; draft limits production |
| Fuel | Coal and petcoke feed, each alternative fuel feed, conveyor delays | Weigh feeders, belt scales, rotor scales | Heat input by fuel, including the delay from feeder to flame [7] |
| Feed | Kiln feed rate, raw meal chemistry (LSF, SM, AM), hot meal SO3 and Cl | Feed bin scale, cross-belt or lab analyzer | Burnability and the volatile cycle [13] |
| Shell | Shell temperature profile along the kiln | Kiln shell scanner | Coating, rings, refractory loss, and hot spots [17] |
| Cooler | Grate pressures, bed height, cooler fan flows, secondary air temperature | Transmitters, drives | Heat recovery and secondary air to the flame [9] |
| Quality | Free lime, clinker phases | Lab, XRD, sampling station | The quality target the whole loop serves [5][9] |
| Stack | NOx, SO2, THC, Hg, HCl, PM, flow | CEMS and data acquisition system | Regulatory limits on rolling 30-day averages [15][16] |
First, the kiln inlet analyzer deserves more attention than it gets. The PCA’s study of sulfur in cement kilns found that dropping excess oxygen from 2 percent to 1.0 to 1.5 percent raised SO2 emissions by roughly 50 to 800 ppm at the plants studied, and that CO destabilizes calcium sulfate and sends more sulfur around the cycle [11]. A practitioner review of preheater blockages lists fluctuating CO and excess O2 among the warning signs, and notes that oxygen up to about 2 percent lowers sulfur volatility [12]. The same analyzer that tells you about fuel efficiency is your early warning for build-ups and for stack SO2.
Second, the shell scanner is usually treated as a maintenance instrument. One manufacturer describes its scanner as continuously tracking hot spots, tire slip, ring formation, brick loss, and thermal warp, and reports outside shell surface temperatures around 450 °C against a flame near 2,000 °C [17]. A ring forming in the transition zone changes how the kiln burns long before it becomes a maintenance event. The scanner’s zone temperatures belong in the process model.
The CEMS stays a regulatory system: the optimizer reads it and environmental staff own it.
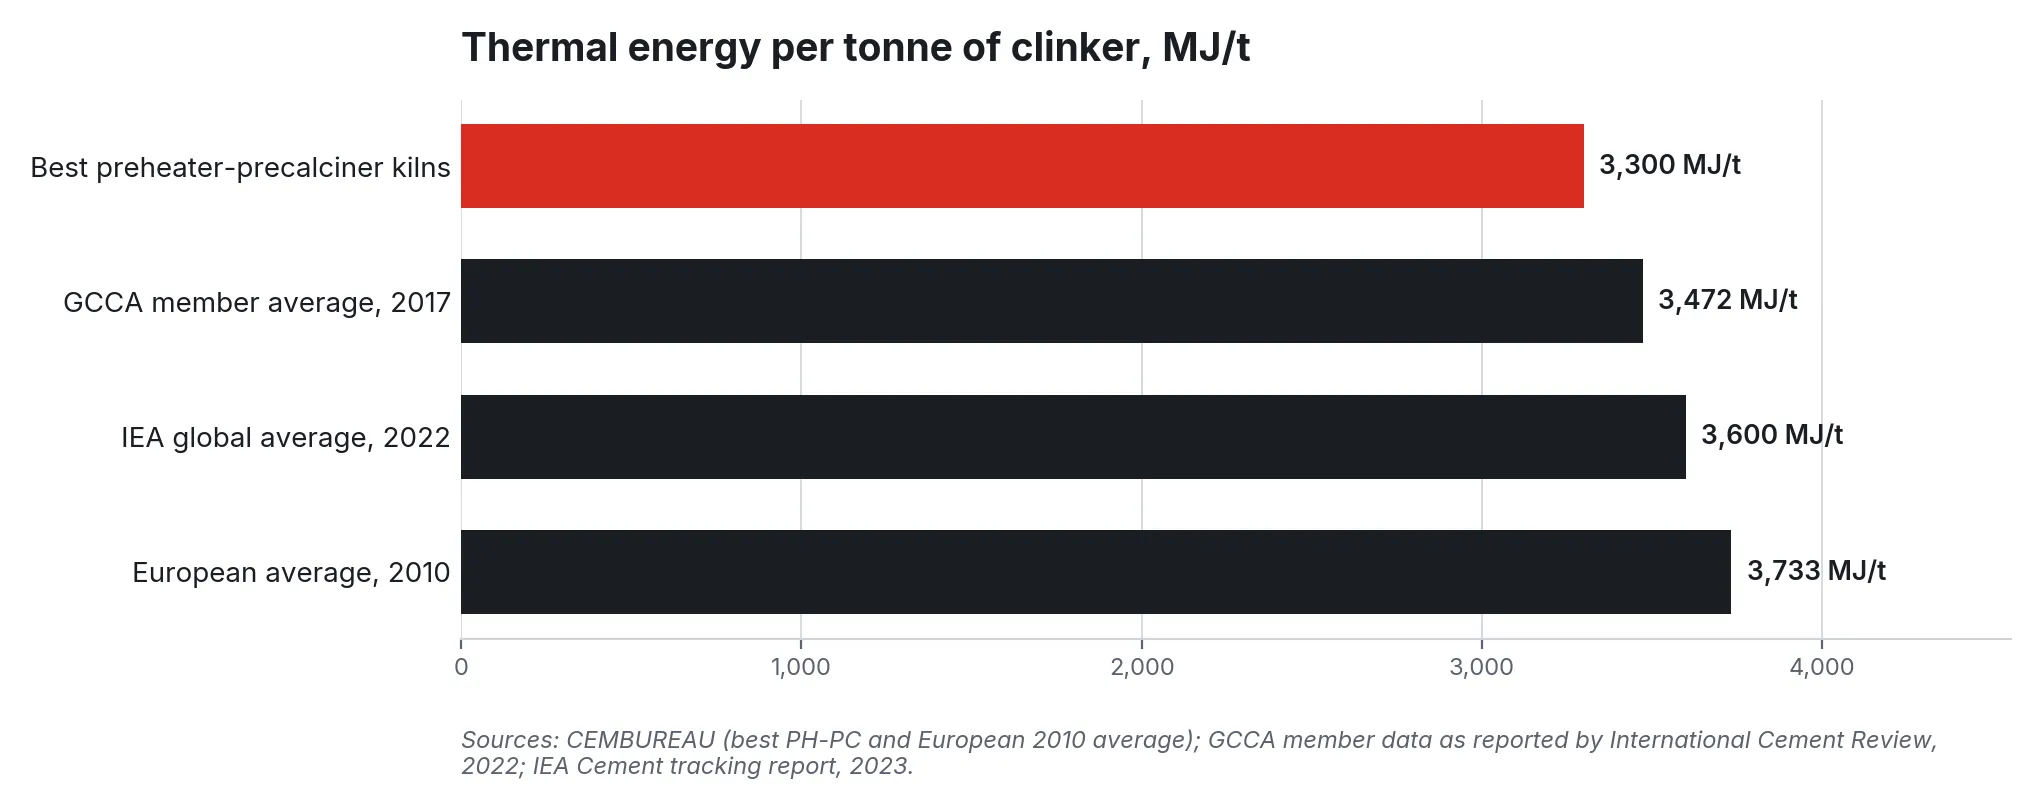
Figure 2. Thermal energy per tonne of clinker. Sources: CEMBUREAU; GCCA member data reported by International Cement Review (2022); IEA (2023).
How fuel variability turns into a kiln stop
Alternative fuels are where kiln control earns its keep. A 2023 review in Energies notes that alternative fuels need a calorific value of roughly 10 to 15 MJ/kg to run economically, that the penalty on clinker production grows with fuel moisture, and that high-chlorine wastes cause operating and environmental problems [14]. The same review recommends keeping the sulfur-to-alkali ratio in clinker within 0.8 to 1.2 to avoid build-ups and rings [14]. CEMBUREAU notes that wetter or lower-heat-value alternative fuels can raise the energy needed per tonne of clinker [2].
The chain from a wet bale of RDF to a kiln stop is short, and every link shows up in a signal you already have.
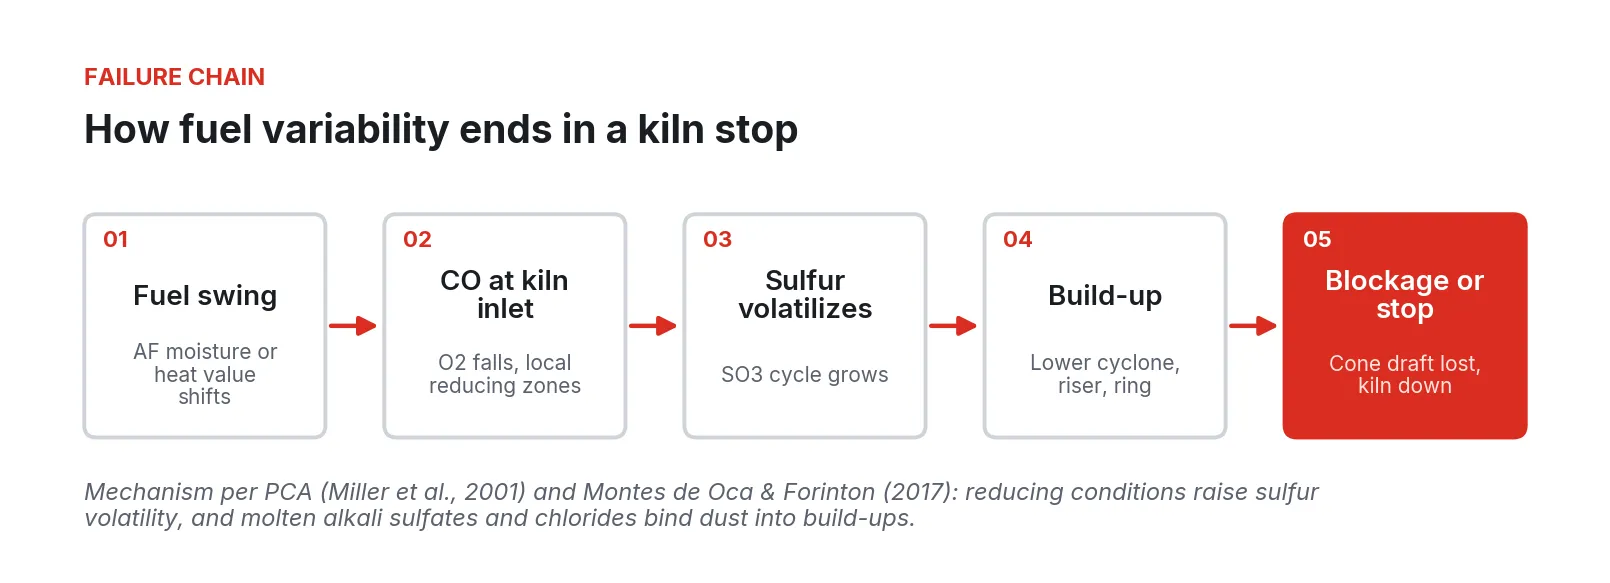
Figure 3. The failure chain from fuel variability to a cyclone blockage or kiln stop. Mechanism per PCA (Miller et al., 2001) and Montes de Oca and Forinton (2017).
- A fuel swing changes heat input and gas volume. Moisture adds water vapor that the ID fan has to move and lowers flame temperature [14].
- Combustion moves toward reducing conditions at the kiln inlet: O2 falls and CO rises.
- Reducing conditions raise sulfur volatility. More SO3 leaves the burning zone and circulates between kiln and preheater [11][12].
- Alkali sulfates and chlorides form a melt that binds dust into build-ups on lower cyclones, the riser, and the kiln inlet, and the volatile cycle feeds rings in the kiln [12][13].
- Cone drafts change, a cyclone blocks, and the kiln comes down for a cleanout.
An operator watching forty trends at 3 a.m. catches this late. The optimizer should watch every link continuously, hold the kiln inlet in the oxygen band where sulfur stays put, and show the operator early which link is moving.
A reference architecture: from the kiln to the control room
The models that act on the kiln run next to the kiln, with no cloud round trip or WAN outage in the loop. Data flows up through the existing control layer to an edge node, and setpoint advice flows back down through the DCS, which keeps every loop and interlock it has today.
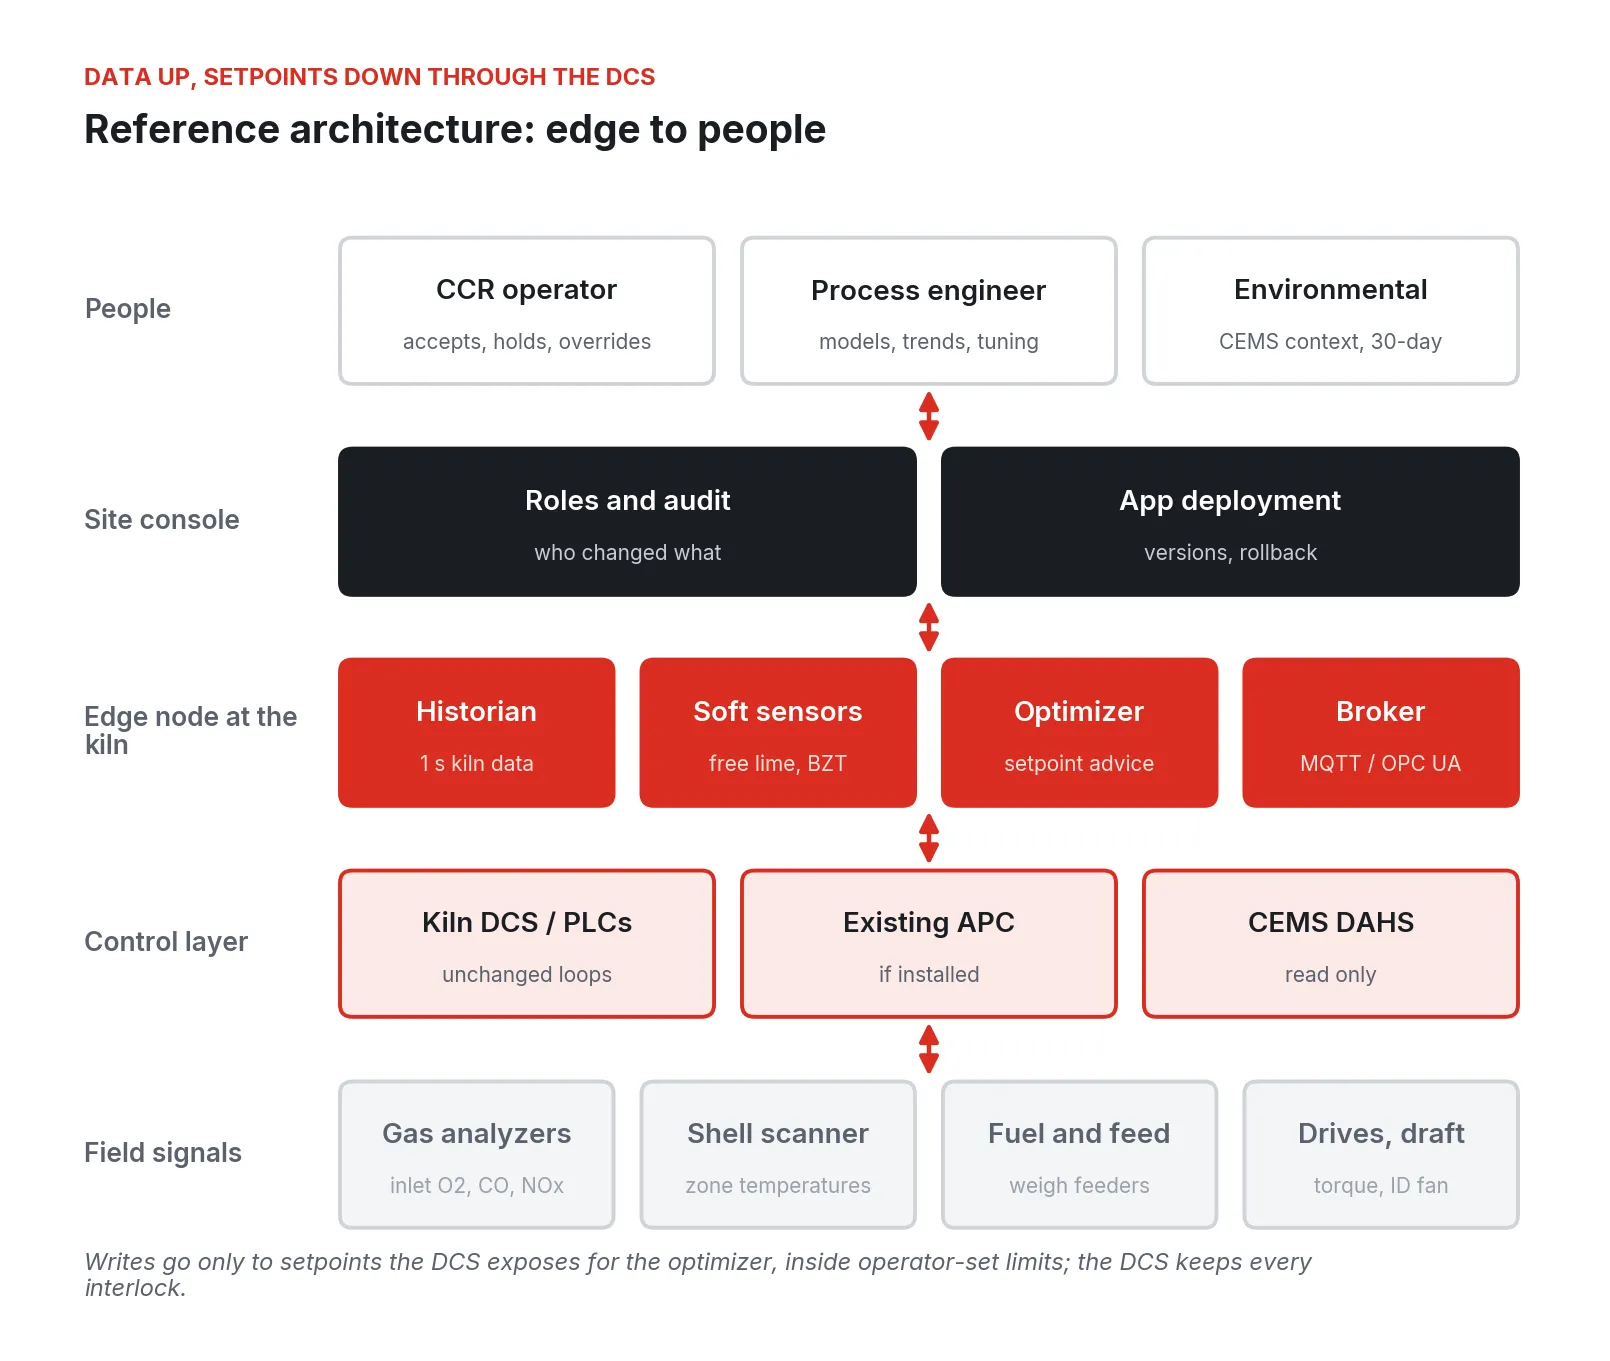
Figure 4. Reference architecture. Data flows up from analyzers, scanner, feeders, and drives through the existing DCS to an edge node at the kiln; setpoints flow back down only through tags the DCS exposes.
From the bottom up:
-
Field signals. Gas analyzers, the shell scanner, weigh feeders, drives, and draft transmitters, all as they are today.
-
Control layer. The kiln DCS or PLCs keep running unchanged. If the plant has an expert system or APC, it stays where it is. The CEMS data acquisition system is read only.
-
Edge node at the kiln. An industrial PC on the control network, close to the DCS, running:
a. A historian that records kiln signals at one second or faster, with quality flags.
b. Soft sensors that estimate free lime and burning zone condition between lab samples.
c. The optimizer, which proposes setpoints for fuel split, feed, and ID fan within limits the operator sets.
d. A message broker (MQTT, or OPC UA from the DCS) so every app reads the same data.
-
Site console. Role-based access, a record of who changed what and when, and a single place to deploy, update, and roll back the apps on the node.
-
People. Operators see the proposal and its reasons on their screen; process engineers see models, trends, and tuning; environmental staff see CEMS data lined up with process data.
The write path is narrow: only setpoints the DCS accepts from the optimizer, with clamps and rate limits in the DCS, and one operator action returns control to the DCS.
Why the edge, and what “real time” means here
The kiln’s own loops stay in the DCS. The optimizer works on a cycle of seconds to a minute; what it needs from the edge is availability, so it keeps running through WAN outages and corporate patching and answers in a predictable time every cycle.
Several models, one managed node
A kiln line tends to collect a free lime soft sensor, a combustion optimizer, a scanner app, and a CEMS dashboard, each on its own PC under a control room desk. One managed node with each app isolated and versioned means fewer unpatched boxes on the control network.
Walking the kiln line, cheapest fixes first
Much of the work comes before any optimizer runs. Go in this order.
1. The kiln inlet analyzer
Report hours in service, in calibration or blowback, and flatlined. Check probe position, cooling, filters, and the blowback cycle, and mark blowback periods as bad quality in the historian so no model acts on them. Every later step depends on this analyzer.
2. Fuel feeders and transport delays
Calibrate every fuel feeder and measure the delay from feeder to flame on each line; conveyed fuels can take many minutes [7]. A model that doesn’t know the delay chases its own moves. Log alternative fuel lots with moisture and heat value where measured.
3. Free lime timing
Record when each sample is taken, reaches the lab, and reaches the operator. Time-stamp results to sample time; that makes past lab history usable for training a soft sensor. One vendor trial reports going from two-hour lab intervals to 15-minute free lime predictions [5].
4. Preheater drafts and temperatures
Trend cone drafts and stage temperatures on every cyclone at one second. A slow change in a bottom-stage cone draft is the earliest sign of a build-up [12]. Add rate-of-change alarms through your alarm management process.
5. The shell scanner
Bring scanner zone temperatures into the historian beside torque, burning zone temperature, and inlet gas, so rings and coating loss show up as process events and refractory planning shares the process history.
6. Line the CEMS up with the process
Pull CEMS one-minute data onto the kiln’s time base, so Tuesday night’s NOx climb is one trend away.
7. Then the optimizer
Now the optimizer has the inputs it needs. Run it in advisory mode first, log every proposal and decision, and close the loop only on setpoints where operators have seen the proposals hold up.
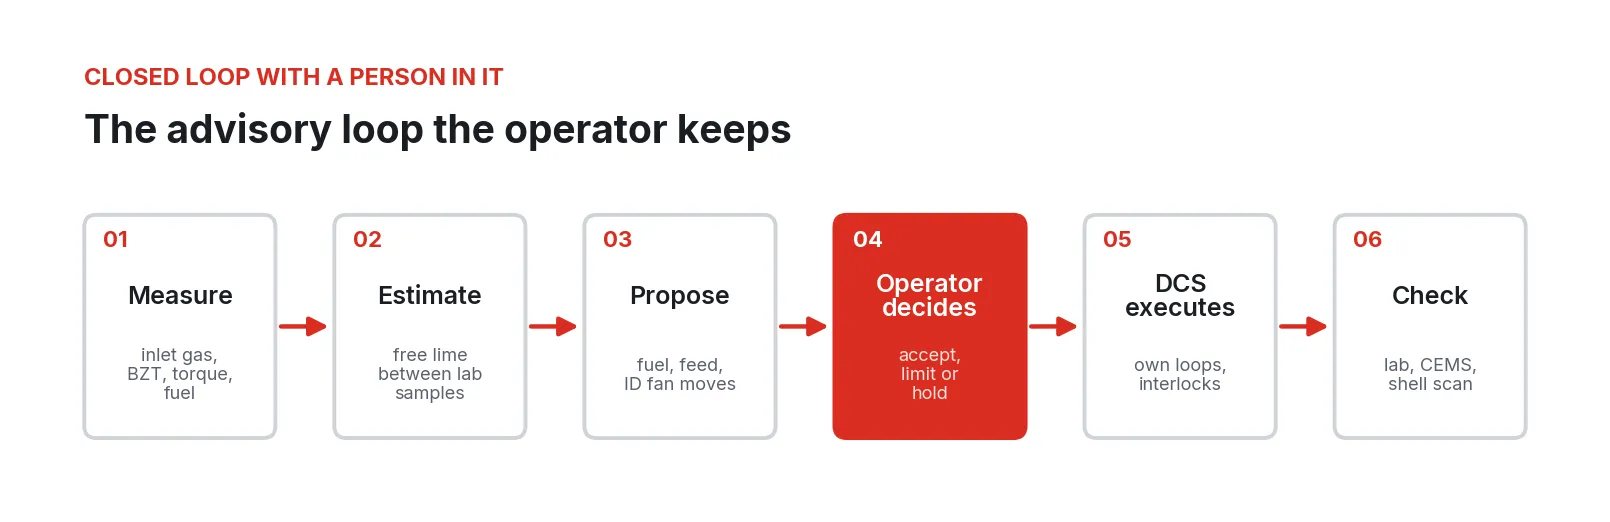
Figure 5. The advisory loop. The optimizer measures, estimates, and proposes; the operator decides; the DCS executes with its own loops and interlocks; the lab, CEMS, and shell scanner check the result.
The operator’s role
The operator stays in charge. The best operator on each crew knows what a particular coal does to the flame and when the scanner is lying. When an operator rejects a proposal, record a reason from a short pick list (“analyzer suspect”, “coating unstable”, “fuel lot change”); after a month those reasons are the best tuning data the project has.
Track utilization by crew, with the reason for every switch-off. One vendor reports utilization above 95 percent on a Turkish kiln [6]. Make your own number the project’s main health indicator, because fuel savings only arrive while the system is on.
Where these projects go wrong
-
Starting with the optimizer. Bad analyzer data and mis-time-stamped lab results produce bad proposals, and the operators switch it off in the first week.
-
No model maintenance. Models drift as equipment and fuels change [8][10]. Name an owner and budget retuning for every burner, fuel line, or raw mix change.
-
Treating alternative fuel as one fuel. Each line has its own delay, moisture, and heat value [7][14].
-
Hidden reasoning. Show the two or three signals driving each proposal [5].
-
Optimizing for fuel alone. The lowest oxygen saves fuel and raises sulfur volatility and SO2 [11]; the objective must include build-up risk, free lime, and stack limits.
-
A cloud dependency in the loop. If the optimizer stops when the WAN drops, operators stop relying on it.
-
Remote access bolted on. An open inbound port or shared VPN account on the kiln network is the common shortcut and the most exposed one.
Security and compliance
Cement plants answer to two sets of rules that touch this architecture: air permits and the federal standards behind them, and industrial cybersecurity practice. The plant’s compliance program owns both. The architecture’s job is to make that program easier to run.
Emissions: the Portland Cement NESHAP and NSPS
Under 40 CFR 63 Subpart LLL, existing kilns face limits including 55 lb of mercury per million tons of clinker, 24 ppmvd THC, and 3 ppmvd HCl at major sources, each on a rolling 30-operating-day average, with work practices in place of numeric limits during startup and shutdown [15]. The rule requires continuous monitoring systems that sample at least every 15 seconds and record an average at least every 60 seconds, and it sets operating limits such as the temperature at the inlet to the kiln’s PM control device [15]. For kilns built or modified after June 16, 2008, 40 CFR 60 Subpart F limits NOx to 1.50 lb and SO2 to 0.4 lb per ton of clinker on a 30-operating-day rolling average, measured with CEMS [16].
For the architecture this means:
- The CEMS and its data acquisition system remain the system of record; the edge node reads them and never recomputes regulatory values.
- An audit trail of every proposal, operator decision, and setpoint write gives the environmental manager the context behind an excursion.
- Optimizer constraints include the operating limits from the plant’s performance tests.
Alarms: ISA-18.2
ISA-18.2 covers the alarm lifecycle from philosophy and rationalization to performance monitoring [19]. New build-up or analyzer-quality alarms go through the plant’s rationalization like any other, so the project doesn’t add to the alarm flood.
Cybersecurity: ISA/IEC 62443
The ISA/IEC 62443 series defines requirements for securing industrial automation and control systems, assigning responsibilities to asset owners (62443-2-1), service providers (62443-2-4), and product suppliers (62443-4-1), with system-level security requirements and security levels in 62443-3-3 and risk assessment for system design in 62443-3-2 [18]. In practice for a kiln line:
- Put the kiln control system and the edge node in a defined zone, with every connection into it a documented conduit.
- Allow no inbound connections from the business network or the internet into the kiln zone.
- Give every person and every device its own identity; no shared accounts for vendors.
- Log every remote session and every configuration change.
- Keep patching controlled and reversible on everything in the zone.
A phased rollout
Start with one kiln line. The schedule below is a template; adjust it to your outage calendar and the state of your instruments.
Figure 6. Phased rollout for one kiln line, from instrument audit to limited closed-loop writes.
-
Audit. Analyzers, feeders, lab timing, and tags; record specific heat consumption and its weekly spread as the baseline.
-
Historian. One-second kiln and CEMS data on one time base, and fuel per tonne by shift.
-
Soft sensors. Free lime estimates validated against new lab results before anyone acts on them.
-
Advisory. Proposals on fuel split, feed, and ID fan within operator limits, each decision logged.
-
Closed loop. Limited writes to proven setpoints, clamps in the DCS, and a named model owner.
What to do Monday
Pull last month’s kiln inlet analyzer trend and count the hours it was in blowback, flatlined, or out of service. Then pull every free lime result for the same month and check whether it is time-stamped to the sample or to the lab entry. Ask each shift supervisor when they last switched the optimizer off and why, and write the answers down. Put those three findings on one page. That page tells you whether your next step is analyzer maintenance, a lab procedure change, or an optimizer that explains itself, and none of it requires a capital request.
Fireball Industries is EmberNet’s master integrator. Fireball’s engineers design, build, and support kiln data and optimization systems on EmberNet, from the instrument audit and edge historian through soft sensors, advisory optimization, and secure remote support, working alongside the plant’s existing DCS, APC, and CEMS.
Sources
- International Energy Agency. “Cement.” Tracking report, September 26, 2023. https://www.iea.org/reports/cement-3
- CEMBUREAU. “Thermal Energy Efficiency.” Cementing the European Green Deal / Low Carbon Economy roadmap, 2018. Archived February 13, 2026. https://web.archive.org/web/20260213050606/https://lowcarboneconomy.cembureau.eu/5-parallel-routes/energy-efficiency/thermal-energy-efficiency/
- International Cement Review (CemNet). “An easy way to reduce thermal carbon emissions.” October 3, 2022. https://www.cemnet.com/Articles/story/173512/an-easy-way-to-reduce-thermal-carbon-emissions.html
- Worrell, E., Kermeli, K., Galitsky, C. “Energy Efficiency Improvement and Cost Saving Opportunities for Cement Making: An ENERGY STAR Guide for Energy and Plant Managers.” U.S. EPA ENERGY STAR / Lawrence Berkeley National Laboratory, August 2013. https://www.energystar.gov/sites/default/files/tools/ENERGY%20STAR%20Guide%20for%20the%20Cement%20Industry%2027_08_2013_Rev%20js%20reformat%2011192014.pdf
- Fuller Technologies (vendor). Sampath, D. “Extending real-time optimization in cement production.” February 11, 2026. https://www.fuller-technologies.com/hub/posts/extending-real-time-optimization-in-cement-production
- ABB (vendor). “Advanced Process Control (APC) and analytics for cement kiln optimization.” Undated. https://new.abb.com/cement/systems-and-solutions/advanced-process-control/advanced-process-control-(apc)-and-analytics-for-cement-kiln-optimization
- Gallestey, E., ABB (vendor). “Advanced Process Control Increases Usage of Alternative Fuels in Precalciners and Cement Kilns.” Undated. https://library.e.abb.com/public/4ee4ca9cd1cd2ed0c1257b350030736a/Advanced+Process+Control+to+increase+Alternative+Fuels+Usage+in+Cement+Kilns_A4_cor.pdf
- Balakrishnan, A., Chandrashekara, R. S., Schoone, S., Siemens (vendor). “AI Kiln Solution for Optimized Control: How to Reduce Energy Consumption and Emissions in the Clinker Process.” IEEE conference paper, undated (file labeled 2023). https://assets.new.siemens.com/siemens/assets/api/uuid:43d0c42a-27e5-4b3a-a4d7-a60852982cf1/2023ieeeaiforkiln.pdf
- Zanoli, S. M., Pepe, C., Astolfi, G. “Advanced Process Control for Clinker Rotary Kiln and Grate Cooler.” Sensors 23(5), 2805, 2023. https://www.mdpi.com/1424-8220/23/5/2805
- Ramasamy, V., et al. “A comprehensive review on Advanced Process Control of cement kiln process with the focus on MPC tuning strategies.” Journal of Process Control 121, 85-102, 2023. https://www.sciencedirect.com/science/article/abs/pii/S0959152422002232
- Miller, F. M., Young, G. L., von Seebach, M. “Formation and Techniques for Control of Sulfur Dioxide and Other Sulfur Compounds in Portland Cement Kiln Systems.” Portland Cement Association, R&D Serial No. 2460, 2001. https://www.penta.net/wp-content/uploads/2021/07/Sulfur_Control_Techniques_In_Cement_Kilns.pdf
- Montes de Oca, P., Forinton, J. “Preheater Blockages: Problem Diagnosis and Solution.” Infinity for Cement Equipment, December 8, 2017. https://www.cementequipment.org/home/key-equipment-working-principles-types-daily-maintenance/preheater-blockages-problem-diagnosis-solution/
- Infinity for Cement Equipment. “The Behavior of Volatile Matter in the Cement Kiln.” February 26, 2021 (updated July 6, 2026). https://www.cementequipment.org/home/the-behavior-of-volatile-matter-cement-kiln/
- Beguedou, E., Narra, S., Armoo, E. A., Agboka, K., Damgou, M. K. “Alternative Fuels Substitution in Cement Industries for Improved Energy Efficiency and Sustainability.” Energies 16(8), 3533, 2023. https://www.mdpi.com/1996-1073/16/8/3533
- U.S. Code of Federal Regulations. 40 CFR Part 63 Subpart LLL, “National Emission Standards for Hazardous Air Pollutants From the Portland Cement Manufacturing Industry” (§§ 63.1341, 63.1343, 63.1346, 63.1350). eCFR, current as accessed September 2026. https://www.ecfr.gov/current/title-40/chapter-I/subchapter-C/part-63/subpart-LLL
- U.S. Code of Federal Regulations. 40 CFR Part 60 Subpart F, “Standards of Performance for Portland Cement Plants” (§§ 60.62 to 60.64). eCFR, current as accessed September 2026. https://www.ecfr.gov/current/title-40/chapter-I/subchapter-C/part-60/subpart-F
- ZKG International (vendor-authored, HGH Infrared Systems). “Better thermal kiln monitoring.” ZKG 9/2015. https://www.zkg.de/en/artikel/zkg_Better_thermal_kiln_monitoring-2411189.html
- International Society of Automation. “ISA/IEC 62443 Series of Standards.” Accessed September 2026. https://www.isa.org/standards-and-publications/isa-standards/isa-iec-62443-series-of-standards
- International Society of Automation. “ISA-18 Series of Standards” (ANSI/ISA-18.2-2016). Accessed September 2026. https://www.isa.org/standards-and-publications/isa-standards/isa-18-series-of-standards