

It is 2:40 in the morning and the inlet meter on a residential pressure zone is reading 38 gallons per minute higher than it did last Tuesday at the same hour. Nobody is watching. The historian stores the value, the SCADA screen shows a number inside its alarm band, and the AMI head-end will not reconcile that zone’s customer reads against its inlet until someone runs the monthly report. A service line has split under a driveway, or a joint has pulled on a cast iron main that went in before most of the crew was born. The water is draining into a storm sewer or a gravel bed, so it never surfaces. It will run until a meter reader notices a sinkhole, a customer calls about low pressure, or the annual water audit shows another bad year.
Every gallon in that leak was pumped, treated, disinfected, pressurized, and paid for. The American Society of Civil Engineers estimates the United States loses about 6 billion gallons of treated water a day and sees a main break roughly every two minutes [1][2]. Utah State University’s 2023 survey of 802 utilities put the average break rate at 11.1 per 100 miles of main per year, with cast iron at 28.6, and found the average failing main is 53 years old [3]. Repairs alone cost the United States and Canada about $2.6 billion a year [4]. The leaks that never surface keep running until someone goes looking.
This paper is for the people who own that problem: distribution managers, non-revenue water (NRW) managers, and the engineers who run the AWWA water audit every year. It covers what to measure, where the analysis should run, how pressure management fits, where these programs stall, and how to stage the work so the first zone pays for the next. Most of it applies on any platform.
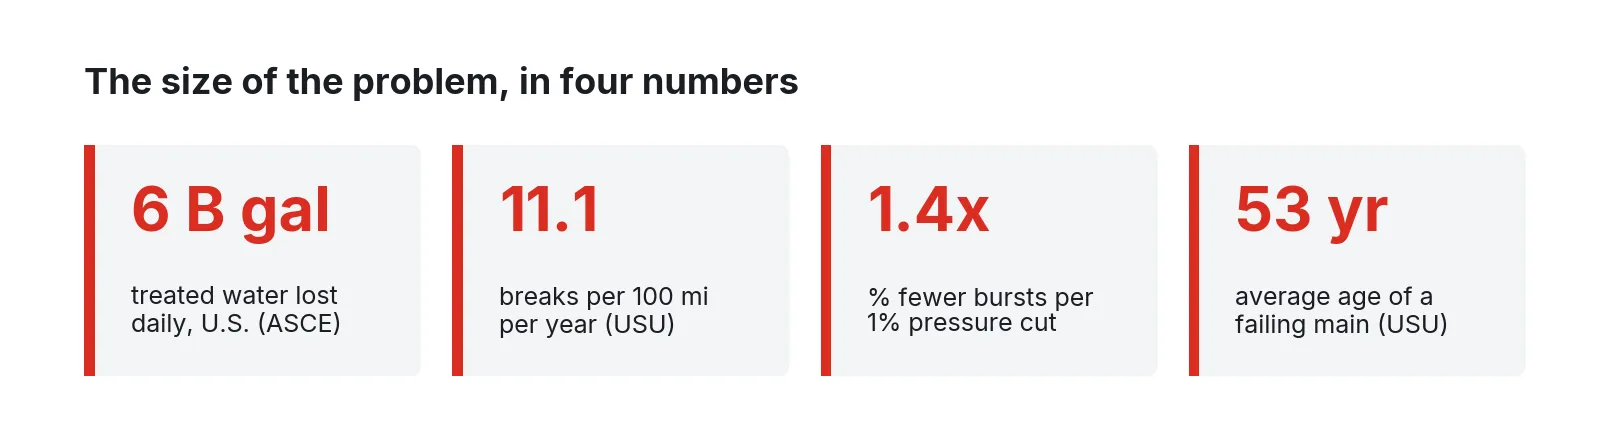
Figure 1. The scale of distribution losses. Sources: ASCE 2025 Report Card [1][2]; Utah State University 2023 [3]; Lambert, Fantozzi, and Thornton 2013 [14].
A self-check for your system
Try to answer these from the data you have today. The ones you can’t answer tell you where to start.
- What is your Infrastructure Leakage Index (ILI) from the last AWWA audit, and what was the data validity score behind it? If the validity score is below 50, the Georgia EPD manual advises treating the audit’s conclusions with caution [9].
- How much of your non-revenue water is real loss (leakage) and how much is apparent loss (meter error, data handling, theft)? Is the split measured, or is it the software defaults?
- How many of your distribution zones have a hydraulically tight boundary and a working inlet meter, and when was each boundary last tested with a zero-pressure test?
- For each metered zone, what is the minimum night flow this week, and how does it compare with the same week last month?
- What is the average and maximum pressure at the average zone point and the critical point of your three highest-pressure zones, and at what time of day does each peak?
- Has any pressure logger in your system ever recorded at 1 sample per second or faster? If not, you don’t know whether you have negative-pressure transients.
- How long, on average, does an unreported leak run between the day it starts and the day the work order closes?
Question 7 is the one most utilities can’t answer, and it drives most of the volume lost.
Why the water audit points at the edge
The AWWA M36 manual, now in its fifth edition, and the free Water Audit Software (version 6.0, released in 2020) give every US utility the same top-down accounting: water supplied, minus authorized consumption, equals water losses, split into apparent and real [7]. EPA’s fact sheet on water audits puts average system losses at about 16 percent and estimates that up to three quarters of that is recoverable [5].
Real losses are leakage and overflows: mains, service connections up to the customer meter, and storage tanks [9]. Apparent losses are water that reached a customer or a thief but was never billed: unauthorized consumption, customer meter under-registration, and systematic data handling errors [8]. AWWA’s guidance values them differently. Real losses are normally priced at the variable production cost of the next unit of water; apparent losses are priced at the retail rate, because that is revenue walking out the door [8]. In water-short regions the M36 method allows real losses to be valued at retail too [8].
The Infrastructure Leakage Index compares current annual real losses (CARL) with the unavoidable annual real losses (UARL) a well-run system of the same size and pressure would still have [10]. UARL is computed from mains length, number of service connections, length of private service pipe to the meter, and average pressure, which puts pressure directly into the benchmark [10]. The guidance cautions that ILI is less meaningful below about 3,000 connections or below 35 psi average pressure [8]. EPA’s 2010 guidance reported early US adopters typically falling between 1.5 and 2.5 [6].
A top-down audit sizes the problem but cannot name the zone, the night, or the street. That takes continuous bottom-up measurement in vaults and on hydrants, and the analysis that turns it into a work order works best close to the sensor.
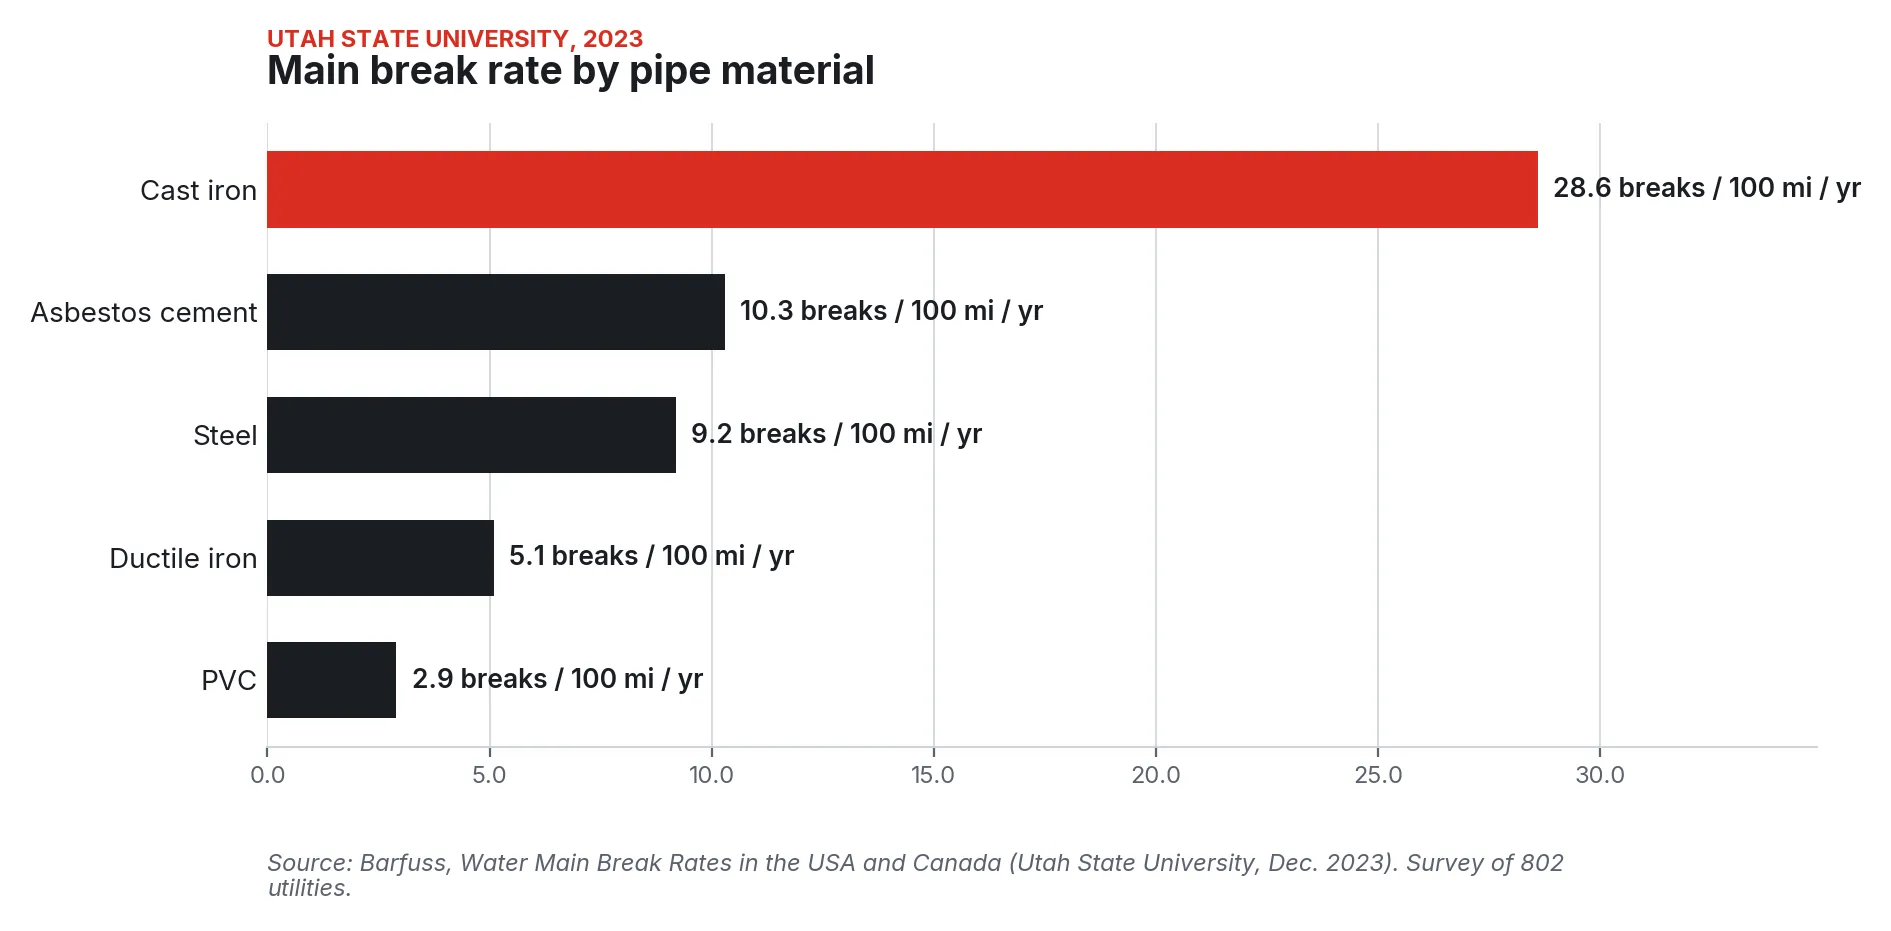
Figure 2. Main break rate by pipe material, breaks per 100 miles per year. Source: Barfuss, Utah State University, December 2023 [3].
What to measure and connect
The signal list below is the minimum useful set for a leakage and pressure program. Most utilities already own some of it; the gap is usually that the data lives in five systems at five resolutions.
| Signal | Typical source | Resolution needed | Why it matters |
|---|---|---|---|
| Zone inlet flow | Mag or insertion meter at the DMA inlet, via RTU or logger | 15 min or better; 1 min for burst detection | Minimum night flow, zone water balance, burst alarms |
| Average zone point pressure | Pressure logger at the AZP | 15 min | Converts night flow to leakage via FAVAD; feeds UARL |
| Critical point pressure | Pressure logger at the highest or most remote customer | 15 min, plus alarm | Sets the floor for PRV setpoint reduction |
| PRV inlet and outlet pressure, valve position | PRV controller or pilot sensors | 1 min | Verifies the valve holds setpoint; catches hunting and creep |
| High-rate pressure | Transient logger at pump stations, PRVs, low points | 1 to 20 samples per second | Captures surges and negative-pressure events |
| Acoustic leak noise | Fixed or lift-and-shift noise loggers on valves and hydrants | Nightly recordings | Finds unreported leaks on metallic mains; supports correlation |
| Customer consumption | AMI interval reads | Hourly | Legitimate night use; zone-level water balance; meter errors |
| Hydrant, vault, and tank access | Hydrant tamper sensors, door switches, flow detection on hydrants | Event | Unauthorized consumption; physical security |
| Pump and tank status | Existing SCADA PLCs and RTUs | Existing poll rate | Explains flow and pressure steps; transient source |
Two notes on the table. Pressure is what turns flow into leakage: the same night flow means a different leak at 50 psi than at 90 psi, and UARL itself scales with average pressure [10]. And ordinary loggers miss transients: in field work prepared for EPA, conventional recorders missed low-pressure events that loggers sampling 1 to 20 times per second captured [16].
Pressure: the lever most utilities underuse
Leak flow is not fixed. The Fixed and Variable Area Discharges (FAVAD) concept, developed by Allan Lambert and colleagues through the IWA Water Loss Task Force, says leak flow scales with pressure raised to an exponent, N1 [12][13]. A rigid hole in a metal pipe behaves near N1 = 0.5, so cutting pressure in half cuts its flow by about 30 percent. A split in plastic pipe or a joint that opens under pressure behaves near N1 = 1.5, so the same pressure cut reduces flow by about 65 percent [13]. Field measurements generally fall between 0.5 and 1.5 [15], and large mixed systems are often modeled at about 1.0, where each 1 percent of pressure removed takes about 1 percent off leakage [13]. Japan has used 1.15 as its standard [12].
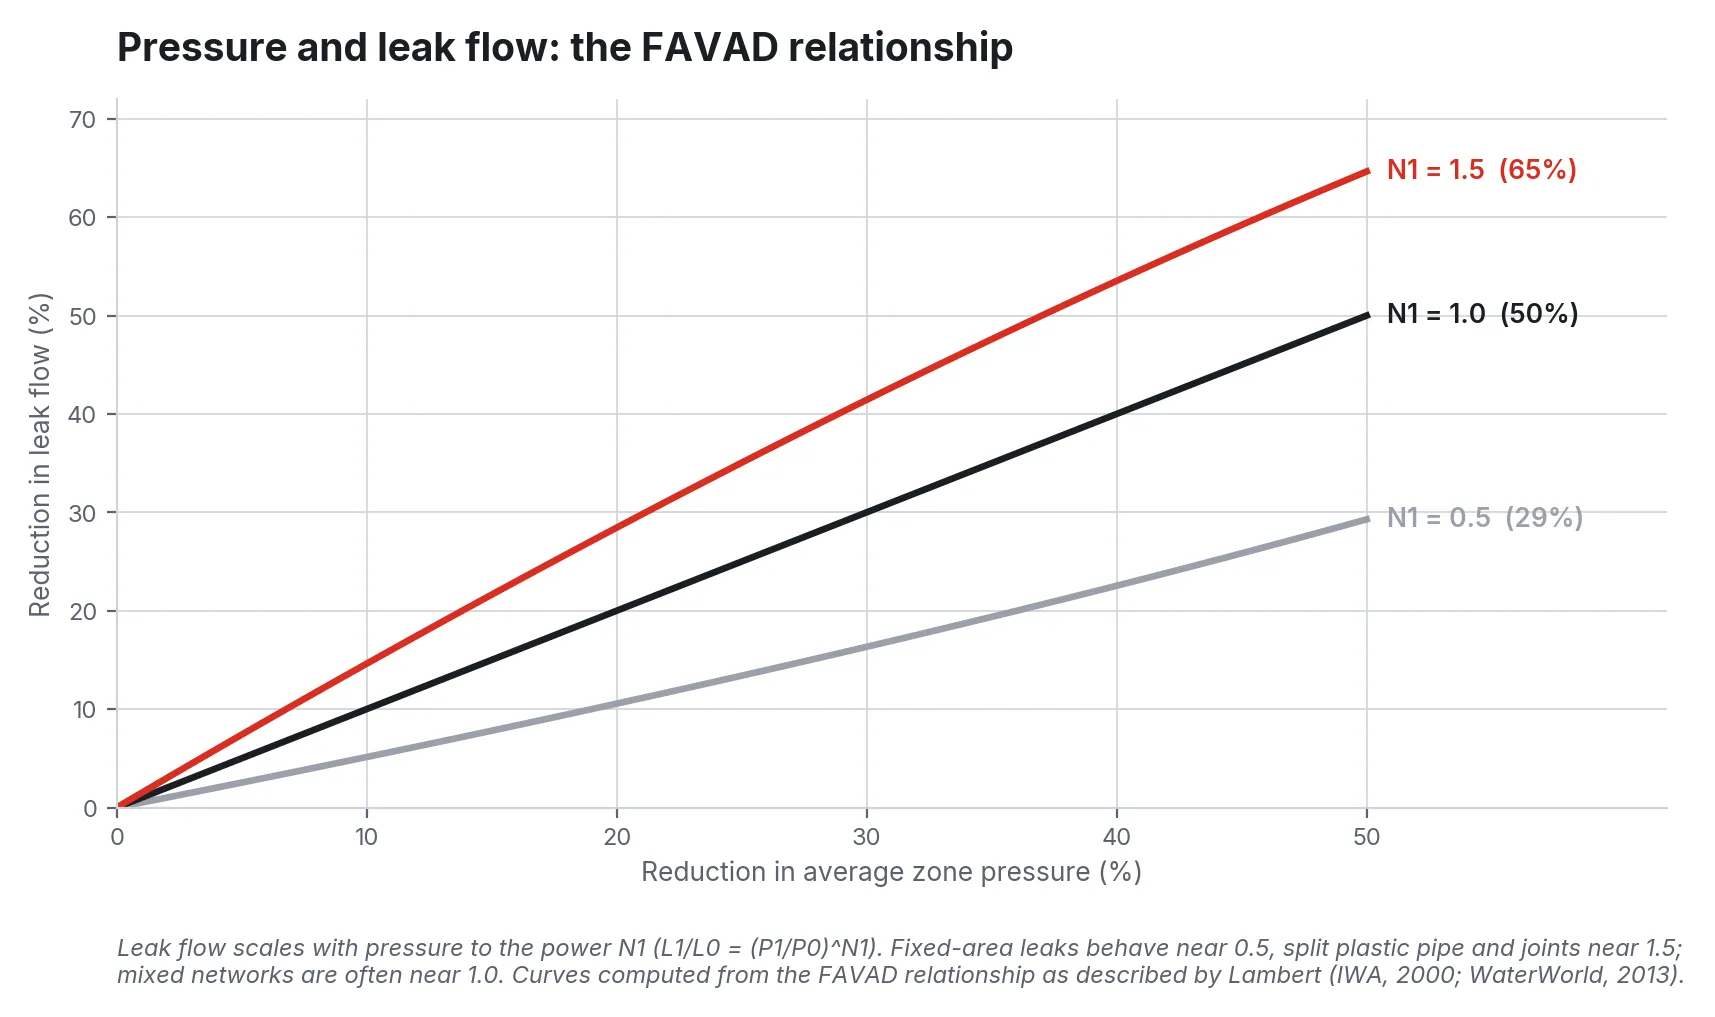
Figure 3. Reduction in leak flow for a given reduction in average zone pressure at three FAVAD exponents. Curves computed from the relationship described by Lambert [12][13].
Pressure also drives how often pipes break. Lambert, Fantozzi, and Thornton’s analysis of 112 case studies in 11 countries found that the percentage reduction in burst frequency averaged about 1.4 times the percentage reduction in average pressure, on mains and services, with a maximum near 3 [14]. Earlier IWA case work reported a 40 percent pressure reduction in Australia cutting new leak frequency on mains, services, and fittings by 55 percent, and pressure management in eight Brazilian sectors bringing new leaks from 155 to 95 per month [12]. In one Australian case Lambert describes, 215 fewer burst repairs were worth about $0.37 million a year, and deferring renewal of 11 km of mains was valued at $2.75 million [13].
The USU survey reported an average operating pressure of 71 psi across respondents and maximums of 120 psi [3]. Many US systems run well above what their customers need at night, because the zone is sized for peak-hour demand at the critical point. That is where flow-modulated or time-modulated PRV control earns its keep: hold the critical point at its service floor, and let average zone pressure fall when demand falls.
The economics depend on your exponent and your water cost. A Portuguese study showed the daily net benefit of the same pressure scheme ranging from €412 to €1,302 depending on whether N1 was 0.5 or 2.5 [15]. Before you commit to a pressure management capital plan, measure N1 in your own zone with a night-time step test: drop the PRV setpoint in stages, hold each for long enough to stabilize, and log inlet flow against AZP pressure.
A reference architecture
The pattern below separates three things that usually get tangled together: high-rate data that should never leave the zone, events and summaries that the control room and NRW team need, and setpoints and work orders that flow back out.
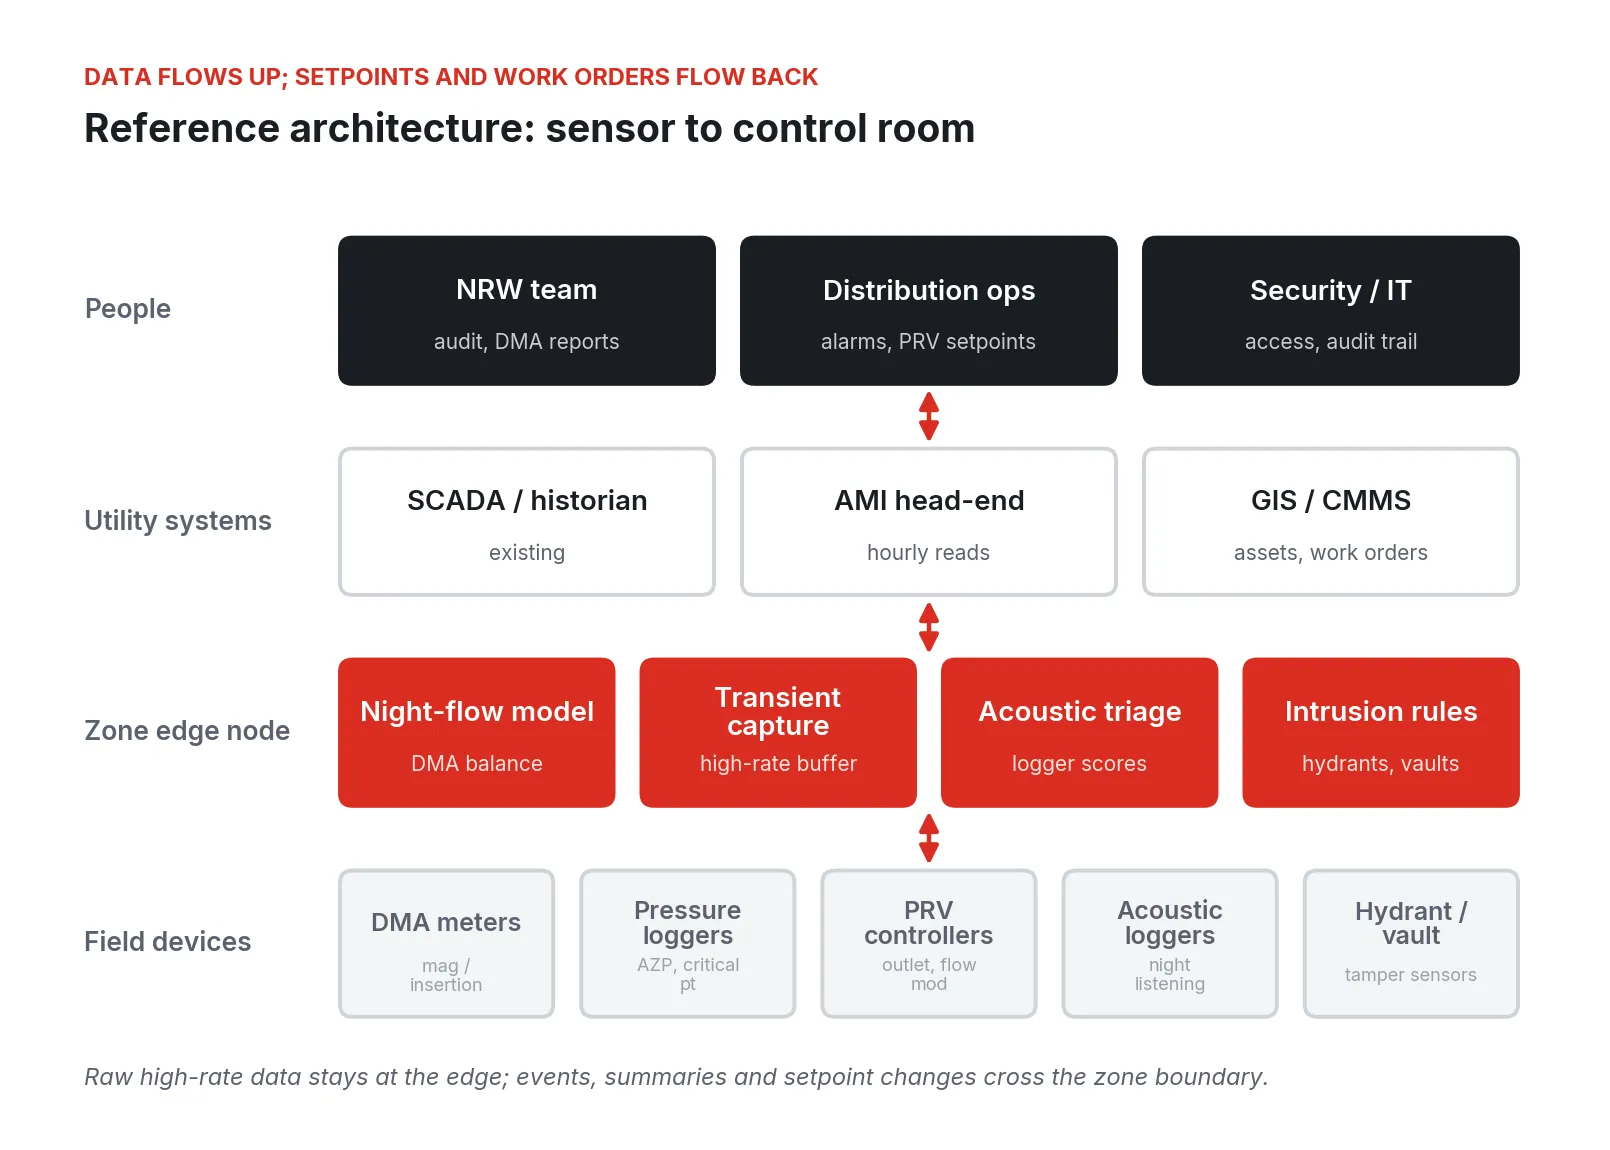
Figure 4. Reference architecture for zone-level leak detection and pressure management. High-rate data stays at the edge; events, summaries, and setpoint changes move between layers.
-
Field devices. DMA inlet meters, AZP and critical-point loggers, PRV controllers, acoustic loggers, and hydrant or vault sensors. Many are battery-powered and report over cellular or LoRaWAN. Some vault sites have line power and a SCADA radio; most hydrants and valve boxes do not.
-
Zone edge node. One industrial computer per pressure zone or per cluster of DMAs, located at a PRV vault, booster station, tank site, or the nearest building with power. It collects the zone’s sensors, buffers high-rate pressure, runs the night-flow model, scores acoustic recordings, and evaluates intrusion rules. It holds data locally when the backhaul drops.
-
Utility systems. The existing SCADA and historian, the AMI head-end, GIS, and the CMMS. The edge node sends events and daily summaries into them through the interfaces they already have.
-
People. The NRW team gets the zone balance and night-flow trend. Distribution operations gets alarms and approves PRV setpoint changes. Security and IT get the access log and the audit trail.
Running the analysis in the zone answers three distribution-specific constraints. A transient logger at 20 samples per second produces far more data than a cellular link sized for 15-minute telemetry should carry, so capture locally and send only the event window. A burst rule is useful in minutes, not at the next batch upload. And the fewer systems that can reach a PRV controller, the smaller the attack surface.
Walking the work, cheapest first
Step 1: Fix the audit before you buy anything
Start with the AWWA audit you already file. Raise the data validity score on the inputs that carry the most volume: production meter accuracy, customer meter testing, and billing data handling. Georgia’s manual recommends at least annual verification of production master meters, semi-annual for high-grade data, and customer meter testing weighted across low, mid, and high flow ranges [9]. If unauthorized consumption is set to AWWA’s default of 0.25 percent of water supplied, the software assigns it a low validity score [8]. Replacing that default with a measured value, even a rough one from hydrant meter records and theft cases, improves the audit and starts the intrusion work.
Step 2: Tighten one DMA
Pick the zone with the worst story: highest pressure, oldest cast iron, most main breaks in GIS. The IWA guidance puts typical urban DMAs between 500 and 3,000 properties and warns that above 5,000 it becomes hard to discriminate small bursts [11]. EPA’s 2010 guidance cites 1,500 to 2,000 service connections as a common size [6]. Fewer inlets means better accuracy, and a single feed is best [11]. Close the boundary valves, run a zero-pressure test, and find the unknown interconnections that cause pressure creep. One leaking boundary valve corrupts the leakage estimate of two zones [11].
Step 3: Watch night flow every night
With a tight boundary and a calibrated inlet meter, minimum night flow becomes the zone’s leak alarm. Take the lowest rolling one-hour average at night, subtract legitimate night use, and trend the remainder [11]. A step change that persists across several nights is a new leak or an opened boundary valve. Either one is worth a truck. The IWA guidance notes that regular analysis of DMA flow cuts leak runtime by reducing awareness time [11].
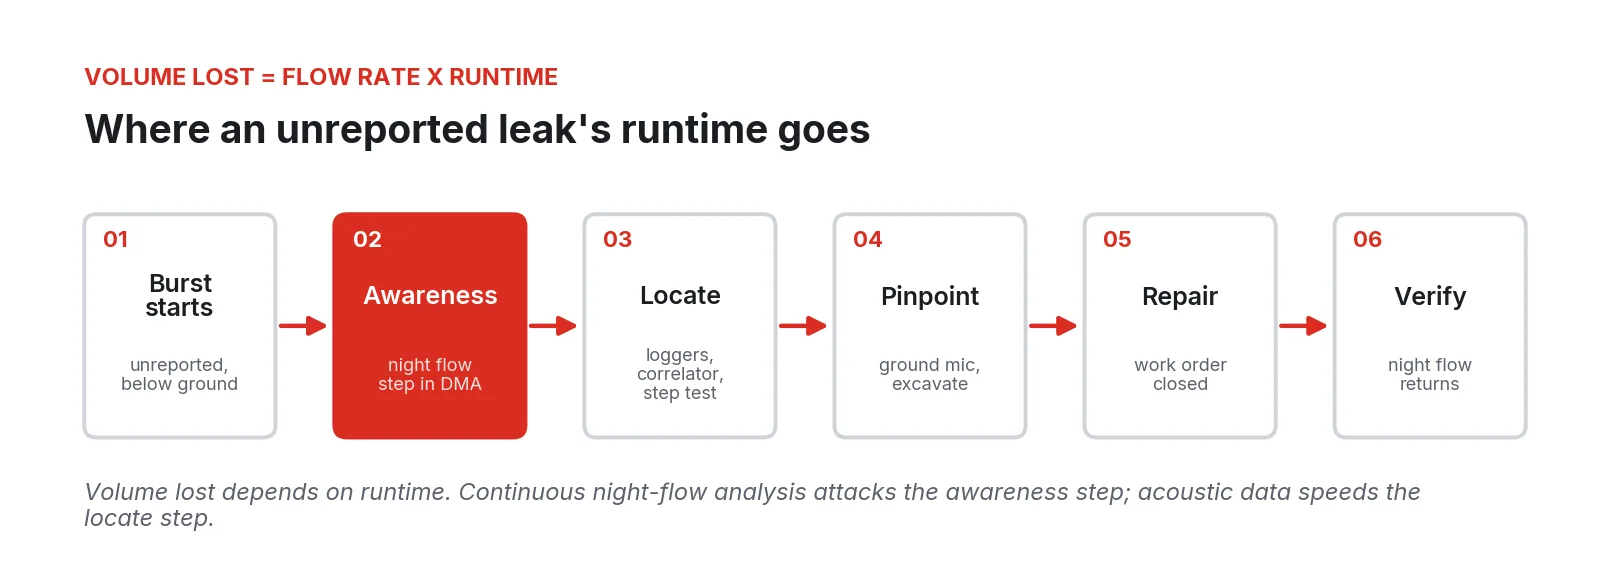
Figure 5. The life of an unreported leak. Volume lost is flow rate multiplied by runtime; night-flow analysis attacks awareness, acoustic data speeds location.
EPA’s guidance illustrates why runtime matters with a simple case: a leak of 1,000 gallons a day running 10 days loses 10,000 gallons [6]. An unreported leak has no natural end date; it runs until a survey, a night-flow alarm, or a failure finds it.
Step 4: Put AMI to work on the water balance
If you have AMI, you have hourly customer consumption. Summed by DMA, it gives a measured legitimate night use and a daily zone water balance: inlet volume minus billed consumption. Persistent gaps point to leakage, to a group of under-registering meters, or to an unbilled account. The edge node does not need to replace the AMI head-end. It needs a daily extract of interval reads mapped to the DMA, which is GIS and billing integration work rather than new instrumentation.
Step 5: Log pressure, then manage it
Install AZP and critical-point loggers and log the PRV’s inlet and outlet. Watch for PRVs that hunt, creep, or fail open. Then run the step test described earlier to measure N1, and trial a time-of-day or flow-modulated setpoint. Keep the critical point inside service and fire-flow requirements.
Step 6: Capture transients
Put at least one high-rate logger at each pump station discharge and at low points downstream of large PRVs. The EPA-sponsored field study by LeChevallier, Gullick, and Karim recorded minus 10 psi for 16 seconds after a pump shutdown and negative 4.4 psi during a 24-second power outage, and noted that all documented negative-pressure events involved power outages or pump shutdowns [16]. The authors concluded that during these events, pipeline leaks give groundwater a potential entry point into treated water [16].
Step 7: Add acoustic triage
Noise loggers on valves and hydrants listen in the quiet hours and flag likely leaks; correlators then locate a leak between two sensors by the time delay of its sound [18]. Two limits matter. Plastic pipe carries leak noise poorly: research by Hunaidi and colleagues found most leak signal energy in PVC below 50 Hz, with attenuation of about 0.25 dB per meter in mild weather, roughly five times that of metal pipe, and worse in winter [17]. DOE’s federal guidance likewise notes that PVC needs closer sensor spacing and longer monitoring [18]. Use acoustics hardest on cast iron and ductile iron, where the USU data shows most breaks occur, and lean on night flow and pressure in plastic zones. Scoring at the edge turns each night’s recordings into a short ranked list for the morning crew.
Step 8: Watch the hydrants and the vaults
Unauthorized consumption is an apparent loss with a public-safety tail. Hydrant draws without a permit or meter, tampered customer meters, and forced vault locks all show up first as small events: a hydrant flow signature at 3 a.m., a vault door opening with no work order, a pressure dip at a hydrant with no flushing scheduled. A node that sees the hydrant sensor, vault switch, zone pressure, and work order list together raises one meaningful alarm instead of several weak ones, and the measured events replace the 0.25 percent audit default with evidence [8].
Where these programs go wrong
-
The boundary leaks. An open or passing boundary valve makes night flow meaningless and can hide or invent leakage in two zones at once [11]. Boundary integrity has to be re-tested after every main repair and valve exercise program.
-
The meter is wrong. Inlet meters installed too close to fittings, or downstream of a PRV whose turbulence disturbs them, produce confident wrong numbers. The IWA guidance recommends placing the PRV downstream of the meter and on a bypass for maintenance [11].
-
Legitimate night use is guessed. A fixed per-property allowance misses the irrigation timer, the hospital, and the car wash. Measure it with AMI or with logged large users.
-
Pressure management stops at the PRV. A setpoint cut without critical-point monitoring produces low-pressure complaints and a quick reversal. A PRV that is never maintained drifts until the benefit is gone.
-
Transients go unseen. Fifteen-minute logging averages away the surge that cracked the main. The EPA-sponsored work showed conventional recorders missing events that high-speed loggers caught [16].
-
Acoustic surveys on the wrong pipe. Loggers placed at metallic spacing on PVC miss leaks and lose credibility with the crew [17].
-
The data never reaches a work order. The most common failure is organizational. Alarms land in a dashboard nobody owns. Every alarm class needs a named owner, a response time, and a link into the CMMS.
Security and compliance
Pressure management puts control actions on unattended equipment spread across a city.
Under Section 1433 of the Safe Drinking Water Act, as amended by America’s Water Infrastructure Act, community water systems serving more than 3,300 people must complete a Risk and Resilience Assessment and an Emergency Response Plan, certify them to EPA, and revisit them every five years [19][20]. EPA’s May 2024 enforcement alert reported that over 70 percent of systems it inspected since September 2023 violated basic Section 1433 requirements, and cited default passwords, shared single logins for all staff, and former employees who kept access [19]. AWWA’s cybersecurity guidance and assessment tool, aligned with the NIST Cybersecurity Framework, give utilities a structured way to work through those controls [20]. The ISA/IEC 62443 series sets out requirements for industrial automation and control systems across their lifecycle and assigns shared responsibility among asset owners, integrators, product suppliers, and service providers [21].
For a distribution edge program, those frameworks translate into a short list of design requirements:
-
Segmentation. Each zone node and its field devices form their own zone. Only defined conduits cross it, and the PRV controller is reachable only from the node that runs its logic.
-
No inbound exposure. Remote vendors and staff should not reach field equipment through open inbound ports or shared VPN accounts.
-
Individual identity and least privilege. Every person and every device has its own credential. Changing a PRV setpoint is a separate permission from viewing a trend.
-
Audit trail. Every setpoint change, deployment, and remote session is logged with who, what, and when, to support the Risk and Resilience Assessment and incident response.
-
Patching without downtime risk. Edge nodes in vaults must be patchable remotely, with a fallback if an update fails.
-
Local survivability. If the backhaul or the central system is down, the zone keeps controlling pressure and keeps logging.
An EmberNode can also sit in front of an existing PLC or RTU at a booster station and microsegment it, leaving the controller running unchanged. Reading its tags is integration work on that controller. On September 29, 2026, an engineer in Austin, Texas, downloaded a PLC application from the CODESYS IDE to a virtual PLC running in a container on an industrial PC in Cleveland, Ohio, over EmberNet, with no VPN and no inbound port opened; that project is deployed with the client.
A phased rollout
Figure 6. A twelve-month rollout that starts with the audit and one district metered area, then adds pressure, transients, and acoustics before scaling.
-
Weeks 0 to 6: audit and one DMA. Raise the validity score on the largest audit inputs. Pick the pilot zone, test its boundary, verify the inlet meter, place AZP and critical-point loggers.
-
Months 2 to 4: night flow live. Install the zone edge node. Run nightly minimum night flow with measured legitimate night use. Send one report each morning with a named owner.
-
Months 4 to 8: pressure. Log the PRV, measure N1 with a step test, trial a modulated setpoint, and add high-rate transient capture at the nearest pump station.
-
Months 8 to 12: acoustics and AMI. Add noise loggers on metallic mains, automate scoring and correlation lists, and run a daily AMI zone balance.
-
Year 2: scale. Repeat in the next zones ranked by audit value, add hydrant and vault intrusion sensing, and carry measured values into the next AWWA audit.
What to do Monday
Pull last year’s AWWA audit and write down three numbers: ILI, data validity score, and the volume and cost of real losses at your variable production cost. Then open GIS and sort your pressure zones by breaks per mile over the last five years. Take the worst zone that has a single feed. Check whether its boundary valves have been tested since the last main repair, and whether its inlet meter has a calibration record. Put a pressure logger at its highest point and its average zone point for two weeks, and pull the inlet meter’s 15-minute data for the same nights.
Then you will know whether the boundary is tight, what the zone’s minimum night flow is, and how much pressure it carries above its critical point at 3 a.m. That is enough to price a pressure trial.
About Fireball Industries
Fireball Industries is EmberNet’s master integrator. Its engineers design, build, and support edge systems like the one described here: zone nodes at PRV and booster sites, integration with existing SCADA, AMI, and CMMS systems, high-rate pressure and flow capture, and the segmentation and audit controls that sit around them. For utilities that want help instrumenting a first district metered area or turning a water audit into a staged program, Fireball does that work end to end.
Sources
- American Society of Civil Engineers, “Drinking Water,” 2025 Report Card for America’s Infrastructure, 2025. https://infrastructurereportcard.org/cat-item/drinking-water-infrastructure/
- American Society of Civil Engineers, “Imagine a Day Without Water,” Report Card for America’s Infrastructure. https://infrastructurereportcard.org/imagine-a-day-without-water/
- Steven L. Barfuss, Utah State University, “Water Main Break Rates in the USA and Canada: A Comprehensive Study,” December 2023. https://digitalcommons.usu.edu/cgi/viewcontent.cgi?article=1681&context=water_rep
- Jay Landers, ASCE Civil Engineering, “Breaking water mains present US, Canada with $452B problem,” April 2024. https://www.asce.org/publications-and-news/civil-engineering-source/civil-engineering-magazine/article/2024/04/breaking-water-mains-present-us-canada-with-%24452b-problem
- U.S. Environmental Protection Agency, “Water Audits and Water Loss Control for Public Water Systems,” EPA 816-F-13-002, July 2013. https://www.epa.gov/sites/default/files/2015-04/documents/epa816f13002.pdf
- U.S. Environmental Protection Agency, “Control and Mitigation of Drinking Water Losses in Distribution Systems,” EPA 816-R-10-019, November 2010. https://dwee.nebraska.gov/sites/default/files/publications/21-014%20-%20Control%20and%20Mitigation%20of%20Drinking%20Water%20Losses.pdf
- American Water Works Association, “M36 Water Audits and Loss Control Programs,” fifth edition (AWWA M36-2024). https://webstore.ansi.org/standards/awwa/awwam362024
- Weston & Sampson for Massachusetts Department of Environmental Protection, “Instructions for Completing an AWWA Manual 36 Water Audit Using AWWA’s Free Water Audit Software.” https://www.mass.gov/doc/american-water-works-association-m36-water-audit-training-document/download
- Georgia Environmental Protection Division and Georgia Association of Water Professionals, “Georgia Water System Audits and Water Loss Control Manual,” version 2.0, March 2016. https://epd.georgia.gov/document/publication/ga-water-loss-manual-v20final3-15-18-updatepdf-0/download
- LEAKSSuite Library, “UARL and ILI.” https://www.leakssuitelibrary.com/uarl-and-ili/
- J. Morrison, S. Tooms, A. Lambert et al., “District Metered Areas Guidance Notes,” version 2, March 2024. https://www.leakssuitelibrary.com/wp-content/uploads/2026/01/IWA-DMA-Guidance-Notes-2024.pdf
- Allan Lambert, “What Do We Know About Pressure:Leakage Relationships in Distribution Systems?” IWA Conference, Brno, May 2000. http://www.geocities.ws/kikory2004/2_Lambert.pdf
- Allan Lambert, “Leakage Reductions: The Fundamental Role of Pressure Management,” WaterWorld, March 1, 2013. https://www.waterworld.com/international/potable-water/article/16201852/leakage-reductions-the-fundamental-role-of-pressure-management
- Allan Lambert, Marco Fantozzi, and Julian Thornton, “Practical approaches to modeling leakage and pressure management in distribution systems: progress since 2005,” CCWI 2013. https://www.leakssuitelibrary.com/wp-content/uploads/2021/05/Practical-progress-in-modelling-leakage-and-pressure-2005-to-2013.pdf
- R. Gomes, J. Sousa, and A. S. Marques, “The influence of pressure/leakage relationships from existing leaks in the benefits yielded by pressure management,” Water Utility Journal 5: 25-32, 2013. https://ewra.net/wuj/pdf/WUJ_2013_05_03.pdf
- Mark W. LeChevallier, Richard W. Gullick, and Mohammad Karim, “The Potential for Health Risks from Intrusion of Contaminants into the Distribution System from Pressure Transients,” prepared for U.S. EPA Office of Ground Water and Drinking Water. https://www.epa.gov/sites/default/files/2015-09/documents/thepotentialforhealthrisksfromintrusionofcontaminants_1.pdf
- Osama Hunaidi, Wing Chu, Alex Wang, and Wei Guan, “Detecting leaks in plastic pipes,” Journal AWWA, 2000 (NRC Publications Archive). https://nrc-publications.canada.ca/eng/view/accepted/?id=1ed6ea85-fd52-4792-9f7b-425ea533b62d
- U.S. Department of Energy, Federal Energy Management Program, “Water-Efficient Technology Opportunity: Distribution System Leak Detection,” June 2017. https://www.energy.gov/cmei/femp/water-efficient-technology-opportunity-distribution-system-leak-detection
- U.S. Environmental Protection Agency, “Enforcement Alert: Drinking Water Systems to Address Cybersecurity Vulnerabilities,” May 2024. https://www.epa.gov/enforcement/enforcement-alert-drinking-water-systems-address-cybersecurity-vulnerabilities
- American Water Works Association, “Cybersecurity & Guidance.” https://www.awwa.org/resource/cybersecurity-guidance/
- International Society of Automation, “ISA/IEC 62443 Series of Standards.” https://www.isa.org/standards-and-publications/isa-standards/isa-iec-62443-series-of-standards