

It is second shift on a cartoning line, and the customer has sent back a pallet. Somewhere in it is a carton with last month’s lot code. The line has a smart camera on it. It was set up two years ago by an integrator who has since moved on, the threshold has been loosened three times because it kept stopping the line, and nobody is sure what it actually checks anymore. Meanwhile an operator at the end of the line is doing a visual check every fifteen minutes between restocking glue and clearing jams.
Most plants that are weighing a vision project are living some version of this. The camera is cheap. What is expensive is everything around it: the escapes that reach a customer, the good product that gets thrown in the reject bin because the system cannot tell a glare spot from a scratch, and the retraining nobody planned for when marketing changes the label.
This paper is for the quality, manufacturing, and controls engineers who have to make one of these stations work and keep it working: choosing between rules and deep learning, lighting and presentation, starting with few defect samples, the PLC handshake, measuring the station like a gauge, and keeping images inside the plant.
Start by measuring what you have
Before anyone picks a camera, find out how well the plant inspects today.
- For the defect you most care about, what fraction of defective parts does your current inspection catch, and how do you know?
- What fraction of good parts does it reject, and where do those parts go: scrap, rework, or a second look?
- What does one escape of that defect cost you, counting the chargeback, the sort at the customer, and the corrective action paperwork? What does one false reject cost?
- Have you ever run an attribute agreement study on the inspectors or the existing camera against a set of known master parts?
- How long does an inspector watch the line without a break?
- When a label or part revision changes, who updates the inspection, and how fast?
- Where do the images from your existing cameras go today, and who can see them?
Without an answer to question 3 there is no business case. Without answers to 1, 2, and 4 there is no baseline, and the station will be judged on anecdotes.
What the human baseline looks like
Some of the most detailed published data on human inspectors comes from Sandia National Laboratories. In one study, 82 trained inspectors examined 140 parts with eight defect types. They correctly rejected 85% of the defective parts, and they also rejected 35% of the acceptable ones [1].
Figure 1. Human visual inspection performance from Sandia studies of trained inspectors. Sources: See, 2015 [1]; See et al., 2017 [2].
A later Sandia review summarizes the wider literature: simple accept/reject tasks can reach error rates near 0.1%, while most inspection tasks run at 20% to 30% error, and liquid penetrant detection in one study was around 50% [2]. It recommends limiting continuous visual inspection to about two hours, and notes that too little time per part causes misses while too much causes false alarms [2].
A second inspector does not fix this. In the Sandia study, when either of two inspectors could reject, hits fell to 77% and false alarms stayed at 32%. When both had to agree to reject, false alarms dropped to 5% and hits collapsed to 40% [1]. You can move the operating point. You cannot get both numbers good by adding people.
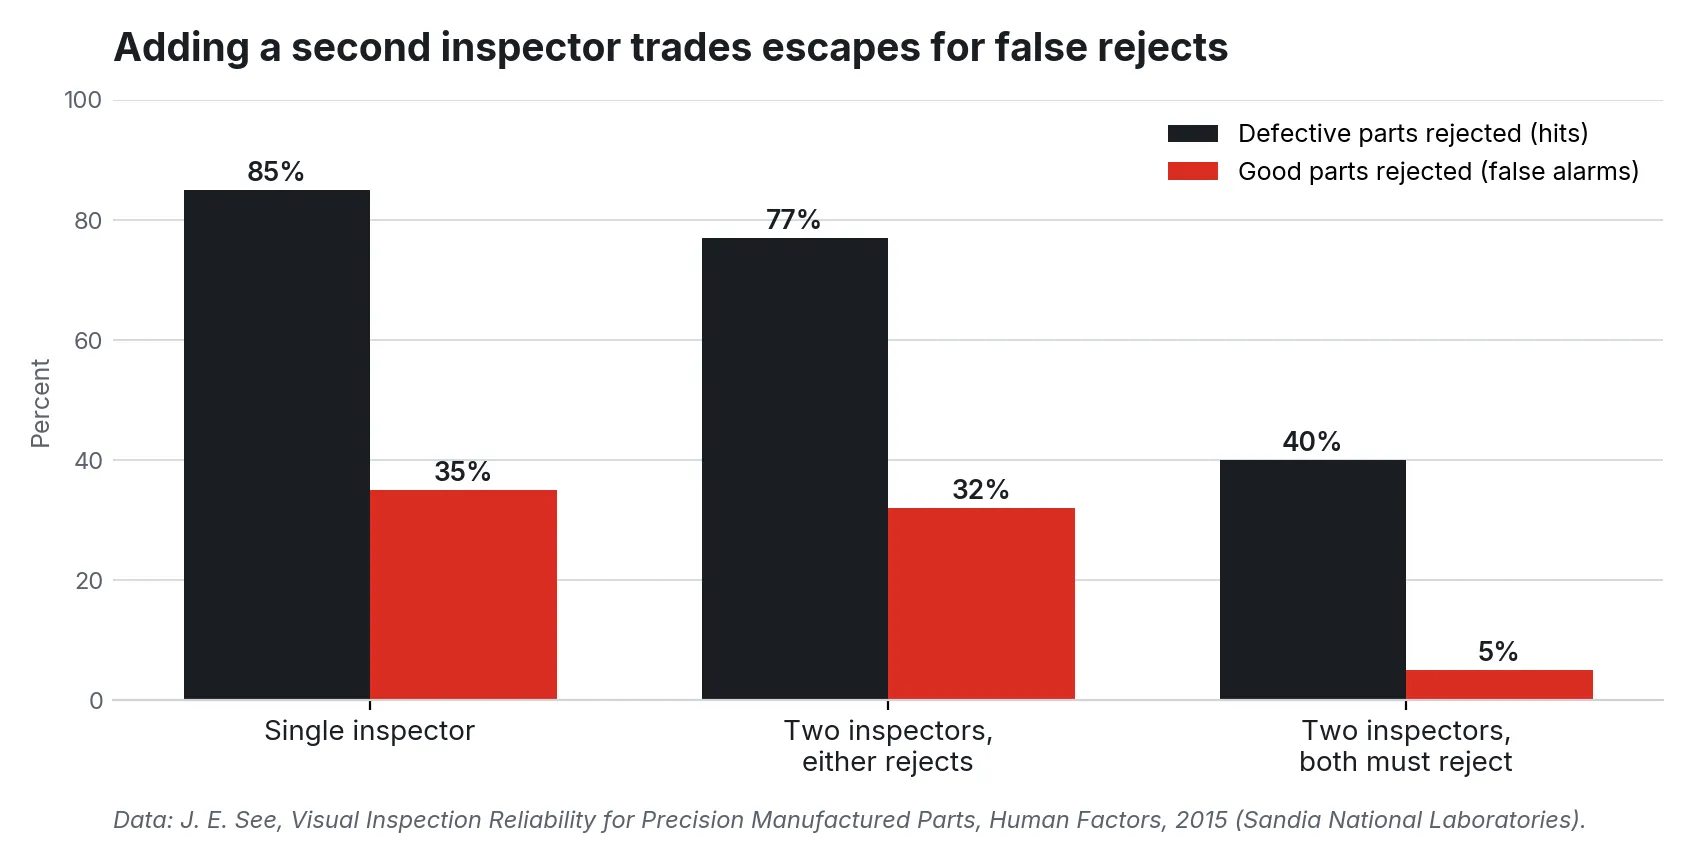
Figure 2. Reinspection shifts the balance between escapes and false rejects without improving both. Data from See, 2015 [1].
What actually needs to be measured and connected
These are the signals that decide whether a vision station works.
| Signal or source | Where it comes from | Why it matters |
|---|---|---|
| Part-present trigger | Photo-eye, proximity sensor, or encoder count from the conveyor PLC | The part must be in the same place in every image; trigger jitter shows up as false rejects |
| Strobe and exposure | Camera I/O driving the light controller | Freezes motion and swamps ambient light from skylights and forklift strobes |
| Line speed and pitch | Encoder or drive speed reference | Sets the time budget for acquire, infer, and decide, and the shift-register distance to the reject |
| Part identity | Serial, lot, or a PLC part index | Ties each image and result to one part for rejection and traceability |
| Recipe or SKU | PLC, MES, or line HMI at changeover | Loads the right model, label template, or tolerances for the product running |
| Inspection result | Vision software output | Pass/fail plus defect class and score, so the PLC acts and quality can trend |
| Reject confirmation | Sensor at the reject chute or bin-full switch | Proves the part that should have left the line actually did |
| Station health | Light intensity, lens focus score, image brightness, trigger count vs. part count | Catches a dimming LED or a bumped camera before it becomes a week of bad calls |
The last row is the one most projects skip. Comparing trigger count to part count every shift is a small PLC change that finds a missing trigger before a customer does.
A reference architecture
The station should decide with nothing connected upstream. Everything above it stores, reviews, retrains, and reports.
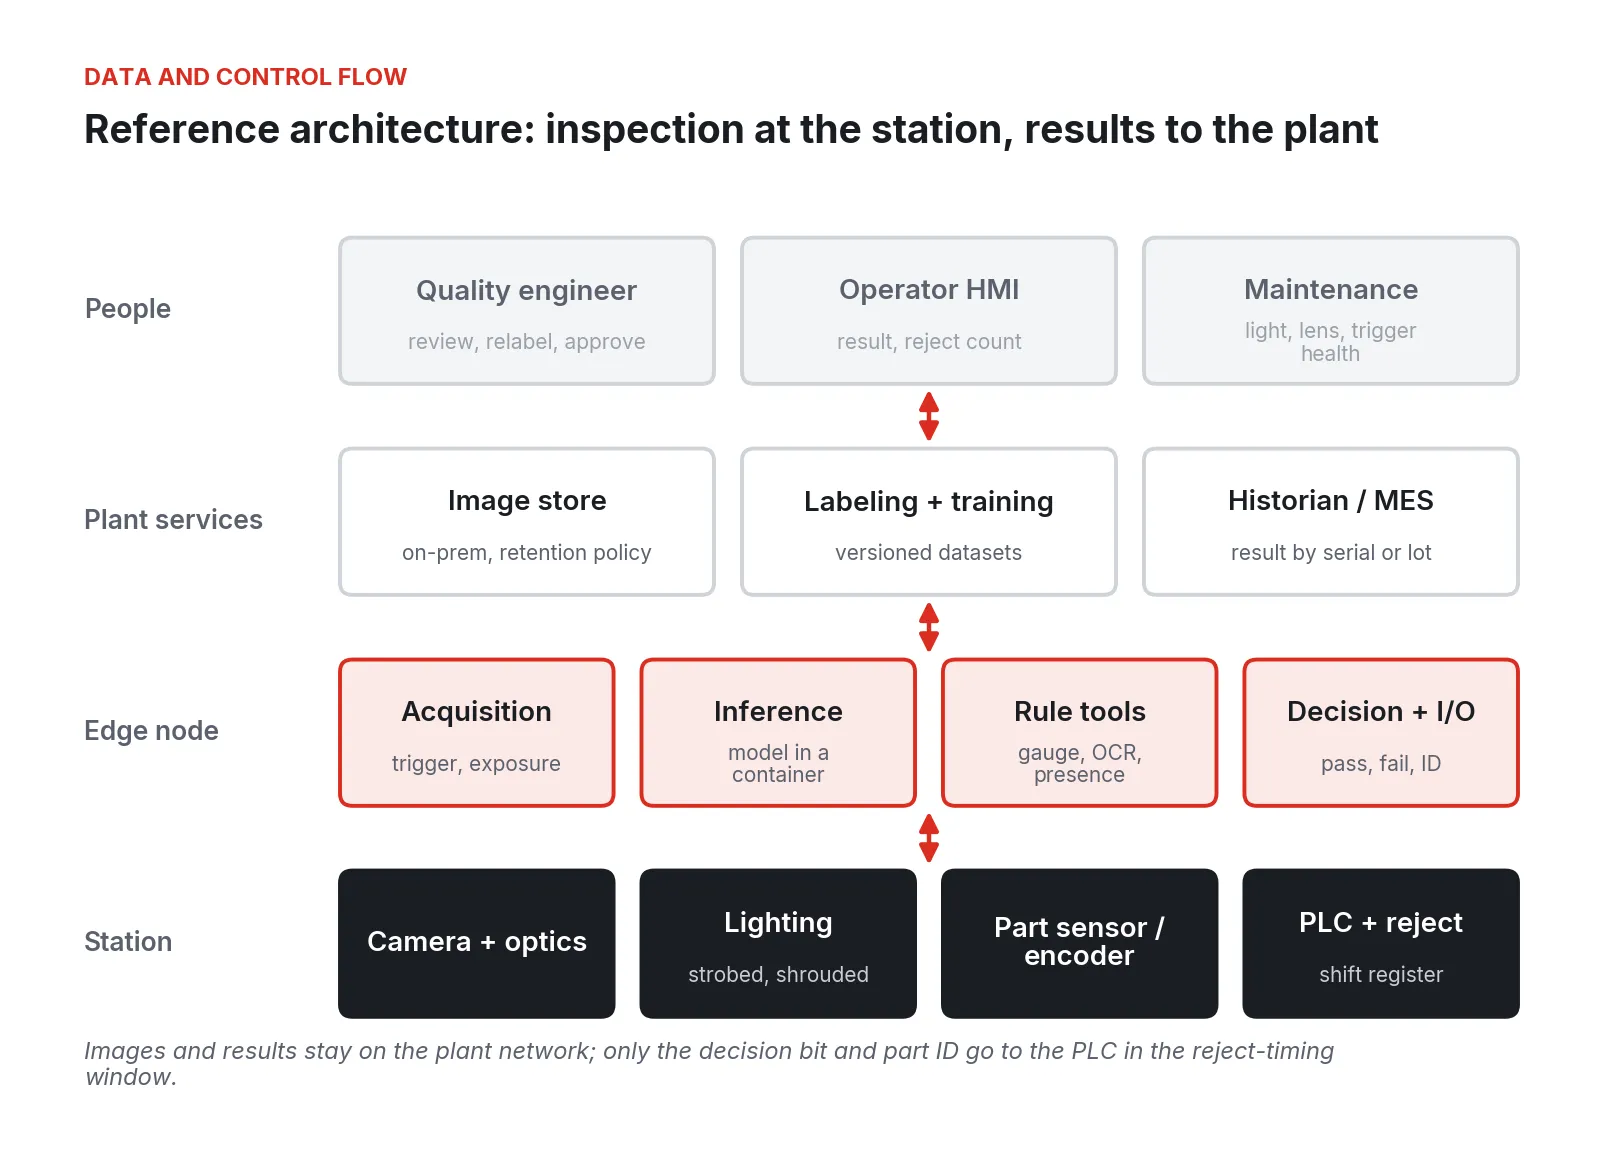
Figure 3. Reference architecture: acquisition, inference, and the reject decision at the station; image storage, labeling, and traceability on the plant network; people at the top.
1. Station. Camera, optics, strobed lighting, part sensor or encoder, and the PLC with its shift register and reject device.
2. Edge node. Acquisition, inference, rule-based tools, and decision logic next to the camera, returning the result with the part ID over the plant’s existing protocol.
3. Plant services. An on-premises image store with a retention policy, versioned labeling and training, and a historian or MES link that stores each result against a serial or lot.
4. People. Quality reviews flagged images and approves model changes, operators see results on the HMI, and maintenance watches station health.
Choosing the tool: rules, supervised learning, or anomaly detection
Deep learning is not a replacement for traditional vision tools. The two are good at different things, and most good stations use both. A3 reported North American machine vision revenue of $2.863 billion in 2024, down 1% overall, while machine vision software grew 14.5% [14].
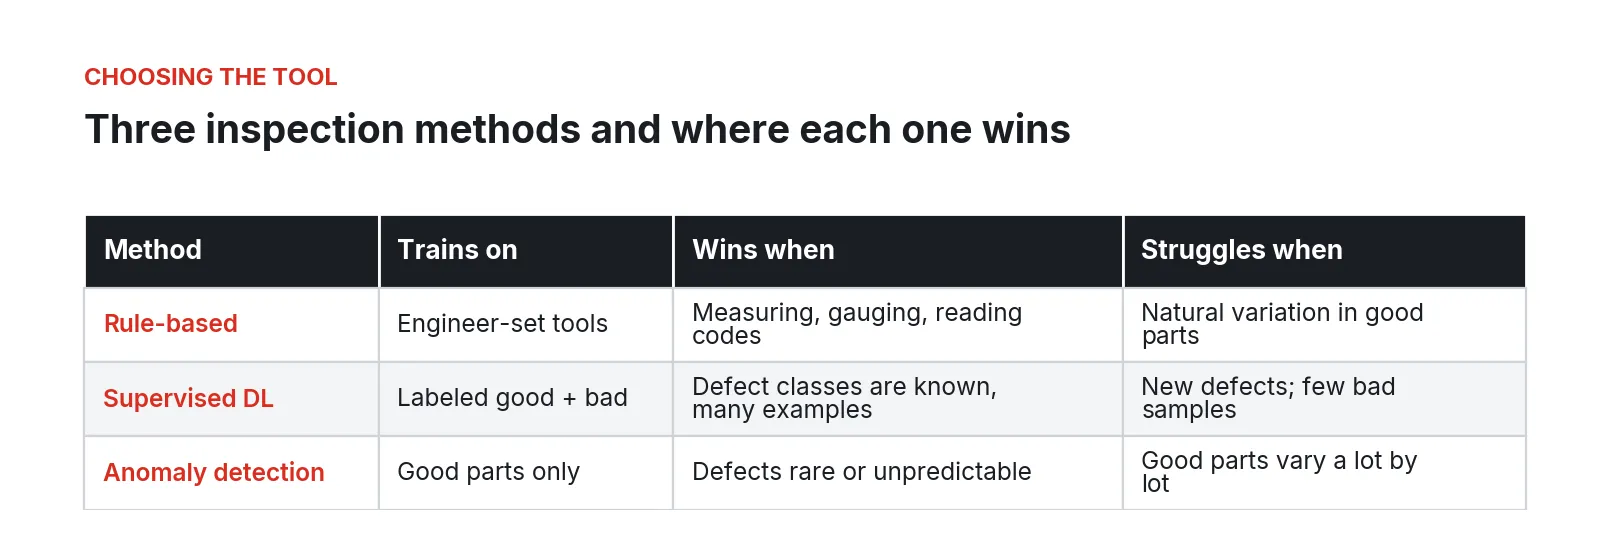
Figure 4. Rule-based, supervised deep learning, and anomaly detection methods compared by training data and best fit.
Rule-based tools
Edge finding, blob analysis, pattern matching, calipers, OCR, and barcode reading are deterministic and explainable. If the job is to measure a gap, confirm a cap is present, read a date code, or verify a 2D code grades, rule-based tools are faster to validate and easier to defend in an audit. Their weakness is natural variation in good parts: cast surfaces, woven fabric, food, wrinkled film.
Supervised deep learning
A supervised classifier or segmentation model learns from labeled examples of good and bad parts. It handles cosmetic judgment calls that are hard to write as rules, but it needs enough consistently labeled examples of each defect class, and a new defect type may pass.
Anomaly detection with few defect samples
Most plants have the opposite data problem: thousands of good parts and a handful of bad ones, because the process is designed not to make defects. Anomaly detection trains only on good parts and flags anything that does not look like them. The MVTec AD benchmark, built specifically for this case, contains 5,354 images across 15 object and texture categories with 73 defect types, and its training sets are defect-free [3][4]. Published methods have become strong on it. PatchCore, a memory-bank approach built on pre-trained image features, reported image-level AUROC of up to 99.6% on MVTec AD while fitting only on nominal images [5].
Two cautions belong next to that number. AUROC measures how well the method ranks defective images above good ones across all thresholds; on the line you pick one threshold, and the escape and false-reject rates at that threshold are what you live with. And benchmark images are cleaner than many production stations. Anomaly detection is a strong way to start with no defect library and to build one: every flagged part a person confirms becomes a labeled defect for a supervised model later.
As a rule of thumb, use rule-based tools for measurements, presence checks, and codes; anomaly detection for cosmetic defects with few bad samples; and supervised models once you have enough confirmed defects and need the station to name them. Run them together on the same image when a station has more than one job.
Lighting and presentation: most of the job
If the feature does not show up clearly in the image, no software will find it reliably. David Dechow, writing in Quality Magazine, puts the contribution of proper imaging at more than 85% of an application’s success [6]. A lighting vendor’s published comparison found a deep learning model trained on well-lit images reached 95.71% accuracy against 82.86% for the same task under poor lighting [7]. That is one vendor’s test, but the lesson holds: deep learning learns the glare along with the defect.
- Choose the lighting geometry for the defect. Backlights for silhouettes and dimensions, low-angle dark field for scratches and embossing, diffuse dome or on-axis light for shiny and curved surfaces, and polarizers for glare on film and foil.
- Shroud the station. Ambient light changes with the time of day and the season; a strobe much brighter than ambient, with a short exposure, removes that variation and freezes motion.
- Fix the presentation. Parts that tumble or arrive at different heights vary more between images than a defect does. Guide rails, a fixed nest, a timing screw, or a vacuum belt are often the cheapest accuracy improvement available.
- Lock the optics. Pin focus and aperture, and put a focus target or a golden part in view at startup so drift shows up as a number.
- Test with real worst-case parts, at full line speed, before anything is trained.
The same vendor reports that if 10% of training data is inaccurate, fixing the model afterward takes about three times more data [8]. Clean images and labels are cheaper than more data.
Labels and training data
Labeling is where vision projects quietly fail, because the people labeling disagree with each other and nobody measures it.
- Write a defect catalog before labeling: each defect with a name, a photo, the acceptance limit, and who decided it.
- Collect images from the actual station, lighting, and camera, across shifts, raw material lots, and seasons.
- Have two people label a sample independently and compare. If they agree less than you would accept from inspectors, fix the catalog before you train anything.
- Keep a held-out test set that is never used for training, including every confirmed escape from the field.
- Version everything: the image set, the labels, the model, the threshold, and the date. A customer complaint on a lot needs an answer that names a model version.
False rejects, escapes, and what each one costs
Every inspection system has two error rates, and turning the threshold trades one for the other, exactly as the Sandia reinspection data showed for people [1]. The right threshold depends on cost.
An escape costs whatever the defect costs downstream: a customer complaint, a sort, a chargeback, a recall. On packaging lines it can be very large: FDA reports that from September 2009 to September 2014, about one-third of foods reported through its Reportable Food Registry as serious health risks involved undeclared allergens [9], the kind of failure a label check exists to catch.
A false reject costs the part, the rework labor, or the person who has to look at it again. In electronics, automated optical inspection flags many boards that turn out to be fine, and those false calls consume operator time. A recent Siemens study set a target of removing at least 40% of those good boards from manual review while letting no more than 1% of true defects slip through [10]. Both numbers were stated as requirements before anything was built.
- Put a dollar figure on one escape and one false reject for the defect in question.
- Decide which error is worse and by how much. On an allergen label, an escape is far worse; on a low-value molded part with an easy manual check, a false reject may be the bigger cost.
- Set the threshold to match, and route rejects to a review lane rather than scrap during the first months so the false-reject rate is measured.
- Report both rates every week.
The PLC handshake and reject timing
The result is only useful if the right part is rejected, and at line speed that is a timing problem.
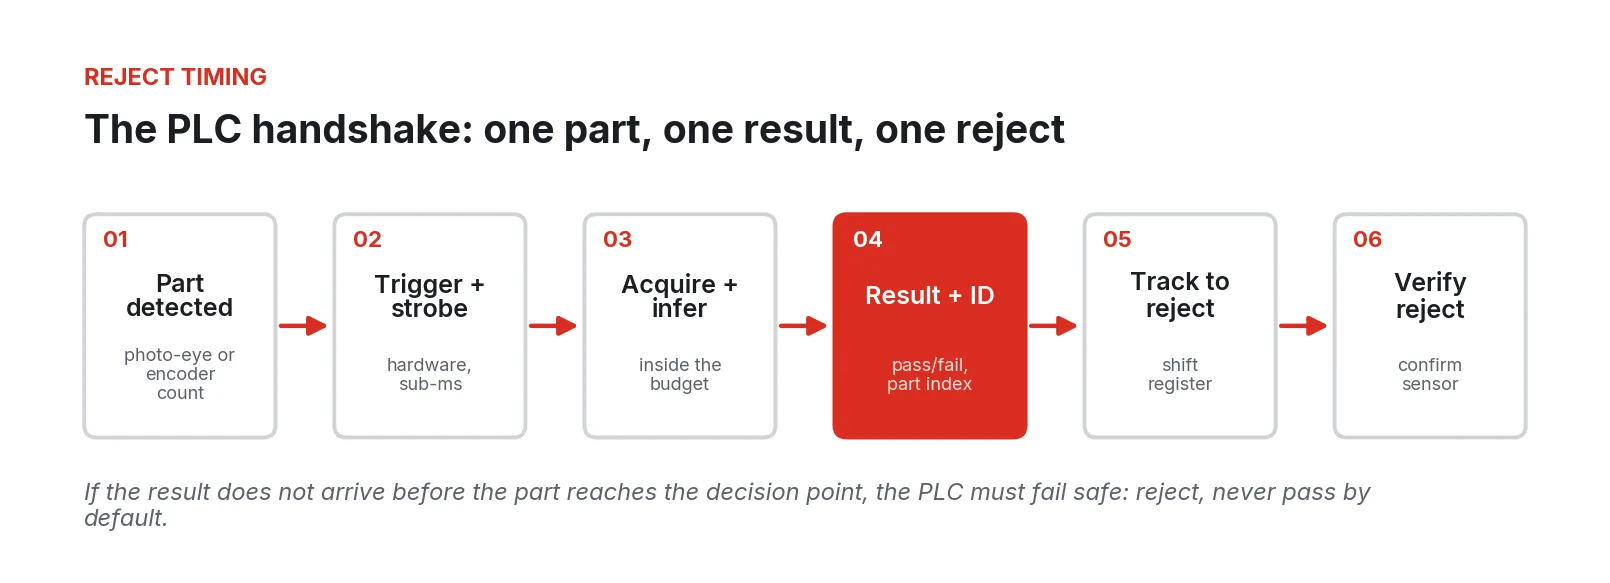
Figure 5. One part, one result, one reject: the trigger-to-reject sequence and the fail-safe rule.
- Trigger in hardware. A photo-eye or encoder count should drive the camera and strobe directly, with no software or network in the path.
- Know the time budget. Camera-to-reject distance divided by line speed is the window. Acquisition, inference, and the result message must fit inside it with margin, at worst case.
- Send the result with an ID. Return pass/fail with the part index or trigger count. The PLC tracks parts in an encoder-keyed shift register and matches results by ID, never by arrival order.
- Fail safe. If no result arrives for a part before it reaches the decision point, reject it.
- Confirm the reject. A sensor at the reject chute proves the part left the line; alarm on unconfirmed rejects and a full bin.
- Count everything. Triggers, results, rejects commanded and rejects confirmed should reconcile every shift.
Inference time varies with model size, resolution, processor, and whatever else runs on the box. Measure the worst case over a full shift before committing to a reject location.
Drift, changeovers and retraining
A model that passed validation in March can be wrong in September with no code change. An LED ages, a camera gets bumped during a jam, a new film supplier changes the gloss, or the artwork changes.
1. Watch the inputs. Track mean image brightness, a focus score, and the distribution of anomaly scores on good parts every shift.
2. Watch the outputs. Trend the reject rate and the review-lane confirmation rate. Rising rejects with falling confirmations means the station is losing discrimination.
3. Tie inspection to change control. A new label, carton, part revision, or supplier should trigger a vision review in the same change-control form that updates the BOM.
4. Retrain from confirmed data. Add newly confirmed good and bad images to the dataset, retrain, and test against the held-out set and every known escape before release.
5. Deploy with a rollback. Keep the prior model ready.
6. Shadow before switching. For any significant model change, run the new model alongside the current one and compare calls before it drives the reject.
Measure the station like a gauge
A vision station deserves the same scrutiny as a CMM. For pass/fail inspection, that means an attribute agreement analysis rather than a variable Gage R&R.
The AIAG measurement systems analysis guidance, as summarized by SPC for Excel, treats an attribute system as acceptable when effectiveness is above 90%, the miss rate is below 2%, and the false alarm rate is below 5%. Effectiveness of 80% to 90%, a miss rate of 2% to 5%, or false alarms of 5% to 10% are marginal, and anything worse is unacceptable [11]. Kappa above 0.75 is generally read as good to excellent agreement, and below 0.40 as poor [11].
Compare those limits to the Sandia inspectors: an 85% hit rate is a 15% miss rate, and 35% false alarms is far outside any of the bands [1]. Most manual inspection would not pass the study the vision station is about to be held to. Run the same study on both.
- Build a master set of parts, roughly half good and half defective, including borderline parts on both sides of the limit. Set the reference decision for each against the customer’s standard.
- Run every part through the station several times, in random order, at production speed, and across at least two presentations (operators loading, shifts, or days).
- Calculate repeatability (does the station agree with itself), agreement with the reference, miss rate, and false alarm rate.
- Run the same parts past the current human inspection.
- Repeat the study after every significant model change and on a calendar schedule, with master parts controlled like calibration standards.
Where these projects go wrong
1. The camera was chosen first. Dechow calls designing around a technology instead of the need a common critical mistake [6]. The order is defect, image, method, then hardware.
2. Lighting was left until the end. The model is trained on images with glare and ambient variation, and it learns them [7][8].
3. Labels were never checked for agreement. Two inspectors disagree on a borderline scratch, both sets of labels go into training, and the model is asked to learn a contradiction.
4. Results were matched by arrival order. One missed trigger shifts every result by one part, and the station rejects good parts while passing the bad one behind it.
5. Missing results defaulted to pass. A network hiccup or a slow inference becomes an escape.
6. The threshold was loosened to stop line stops. Nobody measured false rejects, so the only lever was sensitivity.
7. Nobody owned changeovers. The label changed, the model did not, and the station either rejected everything or, worse, passed the old and new artwork alike.
8. Images went somewhere nobody controls. Images of customer artwork and proprietary parts left the plant for a cloud service without IT, quality, or legal deciding they should.
Keeping imagery on-premises, and the standards around it
Production images are records of product, process, and often customer intellectual property. On a regulated line they may also be quality records. Keeping inference and storage on the plant network makes cycle time independent of an internet link and keeps access decisions inside the company.
IEC 62443
ISA/IEC 62443 is the series of standards for the security of industrial automation and control systems across their life cycle, with defined responsibilities for asset owners, product suppliers, integrators, and service providers, and security levels for system requirements [12]. In practice it asks the site to group assets into zones by function and risk, control the conduits between them, limit and log access, and keep systems patched. A vision station fits that model: camera, PLC, and edge node in one zone, image store and training in another, with defined conduits between them.
21 CFR Part 11 and quality records
Where inspection results or images are electronic records under FDA rules, 21 CFR 11.10 requires validated systems, secure computer-generated time-stamped audit trails of record creation and change, access limited to authorized individuals, authority checks, and retrievable copies through the retention period [13]. The architecture supports those requirements by tying results to part IDs and model versions, logging model deployments, and controlling who changes thresholds or models. The site’s validation and quality program decides whether a given configuration meets the regulation.
A phased rollout for one station
Figure 6. A phased rollout for one inspection station, from baseline study to sustained operation.
1. Baseline (weeks 1 to 3). Build the master parts set and run an attribute agreement study on the current inspection. Write the defect catalog and start collecting images from the line with part IDs.
2. Shadow mode (weeks 3 to 6). Run rule-based tools and an anomaly model on every part, with the result logged and ignored by the PLC. Compare calls and tune lighting while it is cheap.
3. Validate (weeks 6 to 8). Run the attribute agreement study on the station, measure worst-case inference time at line speed, and confirm the reject timing and fail-safe behavior with deliberate missing-result tests.
4. Go live (weeks 8 to 10). Let the station drive the reject, send rejects to a review lane, and keep a reduced human audit until the weekly escape and false-reject numbers are stable.
5. Sustain (ongoing). Station-health alarms, drift trending, changeover reviews in change control, versioned retraining, and periodic re-studies.
The durations are illustrative; a presence check moves faster and cosmetic inspection of a natural product takes longer.
What to do Monday
Pick the defect that has cost you the most in the last year. Pull twenty good parts and twenty bad ones, including the borderline cases, and have your inspectors call each one three times in random order. Calculate the miss rate and false alarm rate and put a dollar figure on each. Then go stand at the station with a phone flashlight and try lighting the defect from four angles; if you cannot make it obvious by eye, no camera will see it either. Those two numbers and that one photo are the start of a vision specification that will survive contact with the line.
Fireball Industries is EmberNet’s master integrator. Fireball designs, builds, and supports vision inspection stations on EmberNet, from lighting and presentation through the PLC handshake, the attribute study, and retraining after the next label change.
Sources
- Judi E. See, Human Factors (Sandia National Laboratories), “Visual Inspection Reliability for Precision Manufactured Parts,” 2015. https://journals.sagepub.com/doi/10.1177/0018720815602389
- Judi E. See, Colin G. Drury, Ann Speed, Allison Williams, Negar Khalandi, Sandia National Laboratories, “The Role of Visual Inspection in the 21st Century,” SAND2017-6457C, 2017. https://www.osti.gov/servlets/purl/1476816
- Paul Bergmann, Michael Fauser, David Sattlegger, Carsten Steger, CVPR, “MVTec AD: A Comprehensive Real-World Dataset for Unsupervised Anomaly Detection,” 2019. https://openaccess.thecvf.com/content_CVPR_2019/papers/Bergmann_MVTec_AD_--_A_Comprehensive_Real-World_Dataset_for_Unsupervised_Anomaly_CVPR_2019_paper.pdf
- MVTec Software, “MVTec AD” dataset page, accessed September 2026. https://www.mvtec.com/research-teaching/datasets/mvtec-ad
- Karsten Roth, Latha Pemula, Joaquin Zepeda, Bernhard Schölkopf, Thomas Brox, Peter Gehler, arXiv (CVPR 2022), “Towards Total Recall in Industrial Anomaly Detection,” 2021. https://arxiv.org/abs/2106.08265
- David L. Dechow, Quality Magazine, “Systems Integration for Machine Vision Solutions: Driving Application Success with Current and Future Technologies,” April 1, 2024. https://www.qualitymag.com/articles/97883-systems-integration-for-machine-vision-solutions-driving-application-success-with-current-and-future-technologies
- Steve Kinney (Smart Vision Lights, vendor), Quality Magazine, “Simplify Deep Learning Systems with Optimized Machine Vision Lighting,” July 8, 2021. https://www.qualitymag.com/articles/96597-simplify-deep-learning-systems-with-optimized-machine-vision-lighting
- Steve Kinney (Smart Vision Lights, vendor), Quality Magazine, “Lighting the Way for Machine Vision and Deep Learning System Success,” January 10, 2025. https://www.qualitymag.com/articles/98502-lighting-the-way-for-machine-vision-and-deep-learning-system-success
- U.S. Food and Drug Administration, “Food Allergies,” accessed September 2026. https://www.fda.gov/food/food-labeling-nutrition/food-allergies
- Korbinian Pfab, Marcel Rothering (Siemens AG), arXiv, “Towards Improved Research Methodologies for Industrial AI: A Case Study of False Call Reduction,” 2025. https://arxiv.org/html/2506.14521v1
- SPC for Excel, “Attribute Gage R&R Studies: Part 2,” accessed September 2026. https://www.spcforexcel.com/knowledge/measurement-systems-analysis-gage-rr/attribute-gage-rr-studies-part-2/
- International Society of Automation, “ISA/IEC 62443 Series of Standards,” accessed September 2026. https://www.isa.org/standards-and-publications/isa-standards/isa-iec-62443-series-of-standards
- U.S. Code of Federal Regulations, 21 CFR 11.10, “Controls for closed systems,” accessed September 2026. https://www.ecfr.gov/current/title-21/chapter-I/subchapter-A/part-11/subpart-B/section-11.10
- Linda Wilson, Vision Systems Design, “A3 Predicts Uptick in Automation and Machine Vision Sales in 2025,” January 27, 2025. https://www.vision-systems.com/factory/article/55263526/a3-predicts-uptick-in-automation-and-machine-vision-sales-in-2025