

On the night of November 15, 2014, the control board at DuPont’s La Porte, Texas plant had shown 32 methyl mercaptan alarms in the 17 hours before the release that killed four workers. The detectors were hydrogen sulfide heads configured to pick up methyl mercaptan, and they alarmed at 25 ppm, against a 10 ppm OSHA ceiling and a NIOSH recommendation of 0.5 ppm. There were no audible or visual alarms in the manufacturing building itself; alarms reached the field by radio from the board. Both rooftop ventilation fans were out of service on an “urgent” work order nearly a month old. About 24,000 pounds of methyl mercaptan came out of the process [1].
Each of those facts was knowable before the release: the alarm count in the control system, the setpoint in the gas controller, the fan work order in the maintenance system. Nobody had them in one place, in front of people who could read them as a pattern.
Most chemical plants, blenders, and toll manufacturers have some version of this. The fixed gas detection system has its own controller and its own panel. The SIS logic solver keeps its sequence-of-events log on an engineering workstation that few people open. Bump tests and calibrations live on paper forms or in a vendor’s portable-instrument dock. Proof test records sit in a binder or a CMMS work order with a PDF attached. When the three-year compliance audit comes, someone spends weeks stitching it together.
This paper describes a monitoring layer that reads from all of those sources, records what happened and when, and stays out of the safety function entirely: which signals matter, how to connect them without compromising SIS independence, how to keep mechanical integrity records OSHA will accept, what to do at sites with no reliable network, and where these projects go wrong. A plant can build it with whatever tools it chooses.
One boundary up front: a monitoring layer does not perform safety functions. It does not trip, it does not vote, it does not bypass. It reads, records, and segments. Everything below follows from that.
Check your own site first
Try to answer these about your plant today, from records rather than memory.
- How many fixed gas detectors are installed, and how many of them are in inhibit, fault, calibration mode, or bypass right now?
- When was each detector last bump tested and last calibrated, and who did it? Can you produce that list for one process unit within an hour?
- How many alarms did the busiest console annunciate yesterday, and which ten tags produced the most?
- How many SIS demands, real and spurious, occurred in the last twelve months, and how does that compare with the demand rate assumed in the SIL calculations?
- Which safety instrumented functions are past their proof test interval, and which bypasses have been active for more than one shift?
- Is there any network path, including a vendor laptop or a shared engineering workstation, that could write to the SIS logic solver from the business network?
- If the plant’s WAN link went down for three days, would you lose any of the above data?
If questions 1, 2, and 5 take more than an afternoon, the evidence exists but is scattered across systems that do not talk.
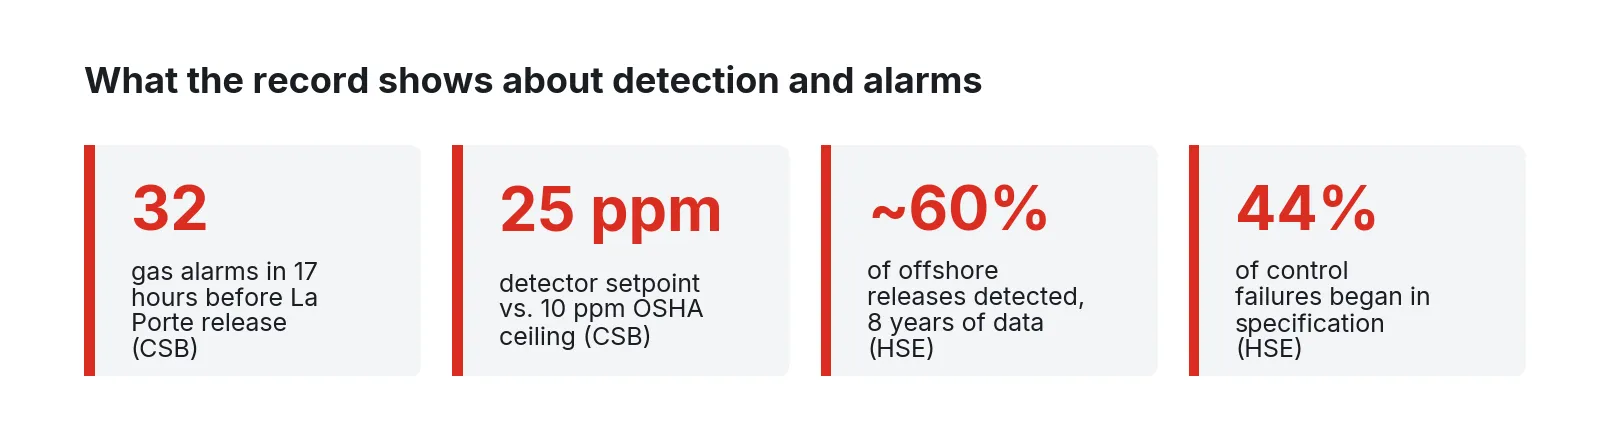
Figure 1. Four numbers from the public record on detection and alarm performance. Sources: CSB La Porte report [1]; HSE offshore fire and gas detection strategy [2]; HSE Out of Control via aeSolutions [10].
What needs to be measured and connected
The useful signals fall into five groups. The table lists them with their usual sources and why each one earns a place.
| Signal group | Typical sources | What to capture | Why it matters |
|---|---|---|---|
| Fixed gas detection | Catalytic and IR LEL heads, electrochemical H2S, Cl2, NH3, HCl, O2 cells; gas controller or fire and gas panel | Concentration, alarm level 1 and 2, fault, inhibit, calibration mode, sensor age | Detection effectiveness depends on detectors being in service and correctly set |
| Process conditions | Pressure, flow, level, temperature transmitters on the BPCS/DCS; analyzers | Values and BPCS alarms around each SIF and each detector zone | Context for every gas alarm and every SIS demand |
| SIS status | Logic solver diagnostics, SOE log, bypass and override status, keyswitch position | Trips, demands, bypasses on and off with timestamps, faults | IEC 61511 operation and maintenance records; detecting a logic solver in program mode |
| Field device health | HART diagnostics, valve partial-stroke results, transmitter deviation alarms | Diagnostic flags, partial-stroke pass/fail, deviation between redundant transmitters | Early sign that a protection layer is degrading between proof tests |
| Maintenance and test events | Portable monitor docks, calibration gas logs, CMMS work orders, proof test procedures | Date, technician, equipment ID, test performed, result, deficiencies | OSHA 1910.119(j)(4)(iv) documentation; trending drift and repeat failures |
Gas detection. The gas controller usually exposes everything through Modbus RTU or TCP, or through a relay and 4 to 20 mA retransmit to the DCS. The DCS copy often carries only the concentration and the high alarm. The fault, inhibit, and calibration-mode bits, which are the ones that tell you a detector is not protecting anyone, often stay inside the gas controller. Get them. At the Aghorn Operating waterflood station in Odessa, Texas, where two people died from hydrogen sulfide in October 2019, the CSB found that the H2S alarm system was not functioning, that detectors did not communicate with the control panel, and that some were in test mode [16].
Coverage. HSE’s analysis of eight years of offshore hydrocarbon release data put the effective detection rate across installations and detection systems at about 60 percent [2]. Onshore plants are not offshore platforms, but the lesson carries over: detector placement and type determine what gets seen, and a monitoring layer cannot detect gas at a place without a detector. What it can do is show which zones produce no alarms ever, which detectors read flat for months, and where repeated low-level alarms cluster, and give the process safety engineer evidence for the next layout review. In HSE’s offshore release data, pipework was the largest leak source at 61 percent of leaks [3], which argues for detectors near flanged piping runs and not only near vessels. IEC 60079-29-2 covers the selection, installation, use, and maintenance of flammable gas detectors and is the usual reference for that review [20].
SIS status. The logic solver’s SOE and bypass data is the most valuable stream and the one that needs the most care, covered in the architecture section below. The keyswitch deserves its own point. After the TRITON malware reprogrammed Triconex safety controllers at a Middle East petrochemical plant in 2017, the FBI advised that operator stations alarm whenever the SIS controller keyswitch is in PROGRAM mode [11]. That is a read-only signal, cheap to collect, and rarely trended.
Maintenance events. OSHA’s portable gas monitor bulletin recommends a bump test or calibration check before each day’s use, full calibration when either fails, and calibration records kept for each instrument’s life so drift and problem units can be tracked [6]. The same logic applies to fixed detectors on their own maintenance interval. A cell that needs adjustment at every calibration is telling you something before it fails.
A reference architecture
The design rule is simple to state. Data flows from the safety and control systems to the monitoring layer. Nothing flows back toward the SIS.
Figure 2. Reference architecture. The monitoring node sits in its own zone, reads from the gas controller, BPCS, and SIS through read-only conduits, records locally, and serves process safety, EHS, maintenance, and operations.
Working from the field up:
1. Field. Detectors, transmitters, and final elements stay wired as they are. Nothing here changes a sensor, voting arrangement, or final element.
2. Read-only conduits. Each source gets its own conduit into the monitoring zone. For the gas controller, that is a Modbus read from a dedicated port, or a retransmitted signal. For the BPCS, OPC UA or the DCS vendor’s historian interface, read-only. For the SIS, the strongest options are the logic solver’s dedicated read-only communication module, an SOE export through the SIS engineering station’s own historian interface, or a unidirectional gateway. The FBI’s TRITON advisory calls for safety systems on isolated networks with unidirectional gateways where data must flow out [11].
3. Edge node. A computer in its own network zone, with a host firewall that permits only the listed read connections inbound from the conduits and only the listed outbound connections to the people layer. It runs the historian, the event store, and the records application, and keeps data locally when the uplink is down.
4. Records and apps. A time-series historian for process values, an event store for alarms, trips, demands, and bypasses, and a mechanical integrity records application that ties each test to an equipment identifier.
5. People. Role-based views: operations sees alarm load and standing alarms; process safety sees demands, bypasses, and overdue proof tests; I&E sees calibrations and bump tests due; EHS sees the audit trail.
On independence: IEC 61511 does not require that the SIS be physically separated from everything, and the standard’s second edition asks that security risks be included in the SIS risk assessment. Hirsch, Gummersbach, and Bartsch describe the range of practice, from air-gapped SIS with hardwired interfaces only, through point-to-point interfaced designs, to integrated two-zone architectures where SIS information flows out read-only and anything inbound passes through controlled intermediaries [12]. A monitoring layer belongs on the outbound side of that line in every one of those designs. It is a consumer of SIS information, never a source of commands to it.
Walking through the work
The order below puts the cheapest, highest-information steps first.
Step 1: Inventory what you have
Pull the gas detector list from the gas controller configuration, not from the drawings. Record for each head: tag, gas, technology, range, alarm setpoints, location, and date installed. Do the same for each SIF: initiating devices, logic solver, final elements, proof test interval, and last test date.
The La Porte setpoint finding is the reason to put setpoints in the inventory. A 25 ppm alarm on a material with a 10 ppm ceiling [1] is visible the moment someone lists setpoints next to exposure limits.
Step 2: Export the alarm journal and score it
Export a few weeks of alarm history and score it against ISA-18.2 and EEMUA 191 benchmarks before building anything.
ISA-18.2 publishes target rates per operator console: about 150 annunciated alarms per day is very likely acceptable and about 300 is the maximum manageable; that is roughly one alarm per ten minutes on average, with a ceiling of two. An alarm flood is more than ten alarms in ten minutes, and the target is under 1 percent of ten-minute periods in flood. Stale alarms should be fewer than five on any day, and chattering alarms should be zero [7]. Real consoles often sit far from that: one vendor’s operator survey found 15 to 200 alarms continuously standing, and in one case 1,000 [9]. EEMUA 191 adds the upset view: under ten alarms in the first ten minutes after an upset should be manageable, and over 100 is very likely to lead the operator to abandon the alarm system [8].
Rank the top ten alarms by count. In most plants they produce a large share of the load, and several of them will be instrument problems: a failing transmitter, a detector drifting near its low alarm, a level switch that chatters. Thirty-two repeats of one gas alarm in 17 hours, which is what La Porte saw [1], should top any bad actor list.
Step 3: Put a monitoring node on one unit
Choose the unit with the most toxic inventory or the most gas alarms. Connect the gas controller first, with fault, inhibit, and calibration-mode status, not just concentration. Then the BPCS points around that unit’s SIFs. Then the SIS SOE and bypass status through the most conservative conduit available.
Leave it running for a full campaign before drawing conclusions.
Step 4: Tie tests to tags
Now the records work. Every bump test, calibration, proof test, and partial-stroke test becomes a record linked to the equipment identifier, with the five elements OSHA lists for mechanical integrity inspections and tests: the date, the name of the person who performed it, the serial number or other identifier of the equipment, a description of the inspection or test, and the results [4]. OSHA has confirmed that computerized records are acceptable when the information is readily retrievable, and that records are kept for the life of the process [5].
The monitoring layer helps by correlating events. When a detector goes into calibration mode, alarms at the calibration gas concentration, and comes back, the event store already has the timestamps. The technician’s record can be matched to that event. When a proof test trips an SIF, the SOE shows which devices responded and in what order.
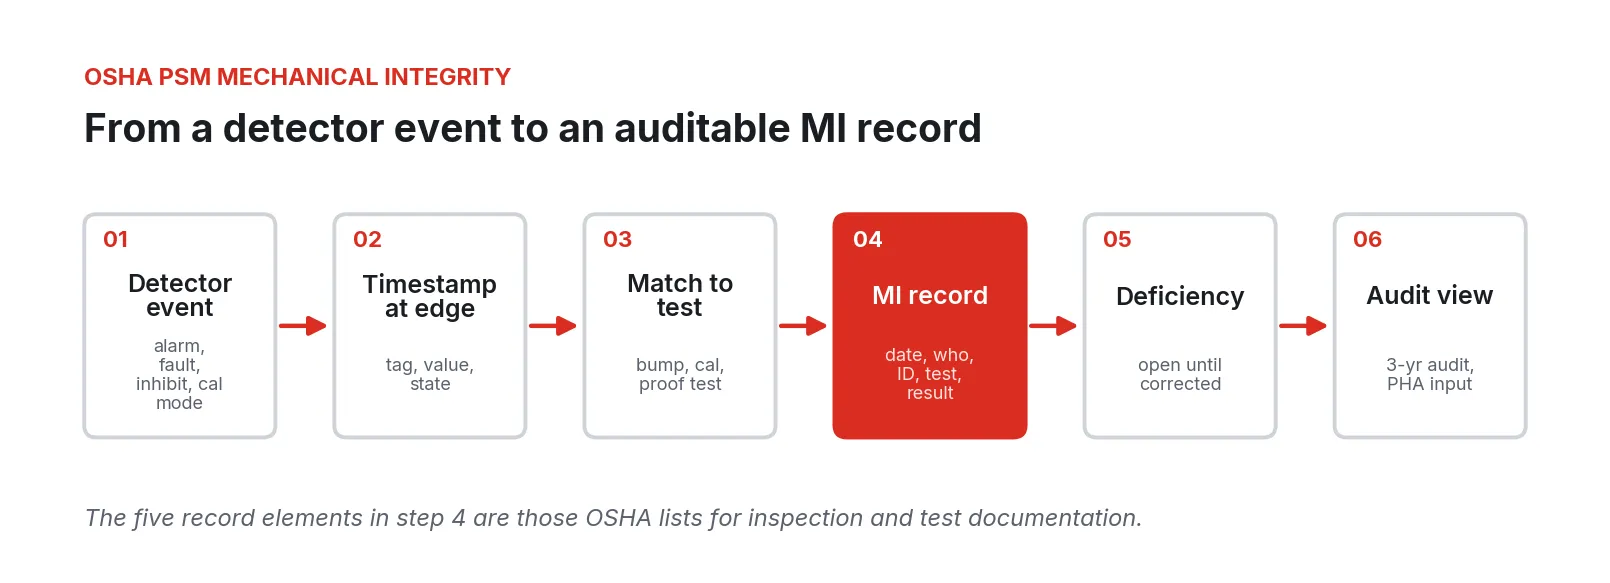
Figure 3. How a detector event becomes a mechanical integrity record. The highlighted step holds the five documentation elements listed in 29 CFR 1910.119(j)(4)(iv).
Deficiencies stay open until corrected. Section 1910.119(j)(5) requires that equipment deficiencies outside acceptable limits be corrected before further use, or in a safe and timely manner with means in place to assure safe operation [4]. A record that shows “failed bump test, removed from service, recalibrated, passed” closes cleanly. A record that shows “failed” and nothing after it is the finding an auditor will write.
Step 5: Track demands and compare with design
IEC 61511 Clause 16 requires recording demands on the SIS, real and spurious, along with faults, trips, and process upsets, and comparing actual performance with the performance assumed in design [14]. The SOE stream from Step 3 gives you the demand count. If an SIF assumed one demand per ten years has had three this year, the SIL verification behind it no longer holds and the PHA team needs to know.
Bypasses get the same treatment. Each bypass on and off is an event with a timestamp and an authorization. A list of bypasses active longer than one shift belongs on the process safety view.
Step 6: Handle the sites with no network
Remote tank farms, terminals, small blending sites, and toll manufacturing suites often have a slow or intermittent WAN link, or a policy that keeps the control network fully disconnected. The monitoring layer has to work there too.
The pattern is local first. The node records everything on site, serves the local views on site, and syncs to the corporate historian or records system only when a connection is available, or when someone carries the data across a controlled transfer. Nothing in the safety records depends on the link being up. This also covers power: EPA’s 2024 RMP amendments added consideration of power loss to hazard evaluations and backup power for perimeter monitors [19], and a node on the same UPS as the gas controller keeps recording through an outage.
Where these projects go wrong
The public record is specific about how monitoring and alarm systems fail. These are the patterns that come up most.
1. Measuring the wrong thing. HSE’s study of control system failures, Out of Control, traced 44 percent to the specification phase, including inadequate safety integrity requirements, against 15 percent to operation and maintenance [10]. A monitoring project that collects concentration but not detector status, or SIS trips but not bypasses, has a specification failure built in.
2. Alarm normalization. La Porte’s 32 repeat alarms became background, associated with routine troubleshooting [1]. Adding a monitoring layer that generates its own notifications on top of the DCS alarms makes this worse. The monitoring layer should report on the alarm system, not add to it.
3. Out of service and invisible. At Aghorn, detectors were not communicating with the panel and some were in test mode [16]. At BP Texas City in 2005, a level indicator on the raffinate splitter read toward normal while the tower overfilled, and the redundant high-level alarm did not activate; 15 workers died [15]. Status bits and transmitter deviation checks exist to catch exactly this, and are often left uncollected.
4. Known problems with no closure. DuPont’s own auditors had identified ineffective building ventilation about five years before the La Porte release [1]. A records system should show every open deficiency with its age.
5. Write paths nobody planned. A shared engineering workstation, a vendor remote-access tool, or an OPC server configured read-write can turn a monitoring connection into a path to the SIS. TRITON changed the programming of the safety controllers themselves, and the FBI’s mitigations start with isolated SIS networks and secured engineering workstations [11]. Every conduit should be reviewed for write capability, and the answer should be written down.
6. Changes after commissioning. HSE attributed 20 percent of control system failures to changes after commissioning [10]. Alarm setpoints, detector ranges, and SIS bypass logic change over the life of a plant. If the monitoring layer’s configuration is not under the same management of change as the systems it reads, its picture drifts away from the plant.
7. Mechanical integrity paperwork that does not hold up. Mechanical integrity was the most-cited PSM element in OSHA enforcement in both 2016 and 2017, and inspection and testing was the most-cited subsection within it [17]. Often the test was done but the record is incomplete, untied to equipment, or lost.
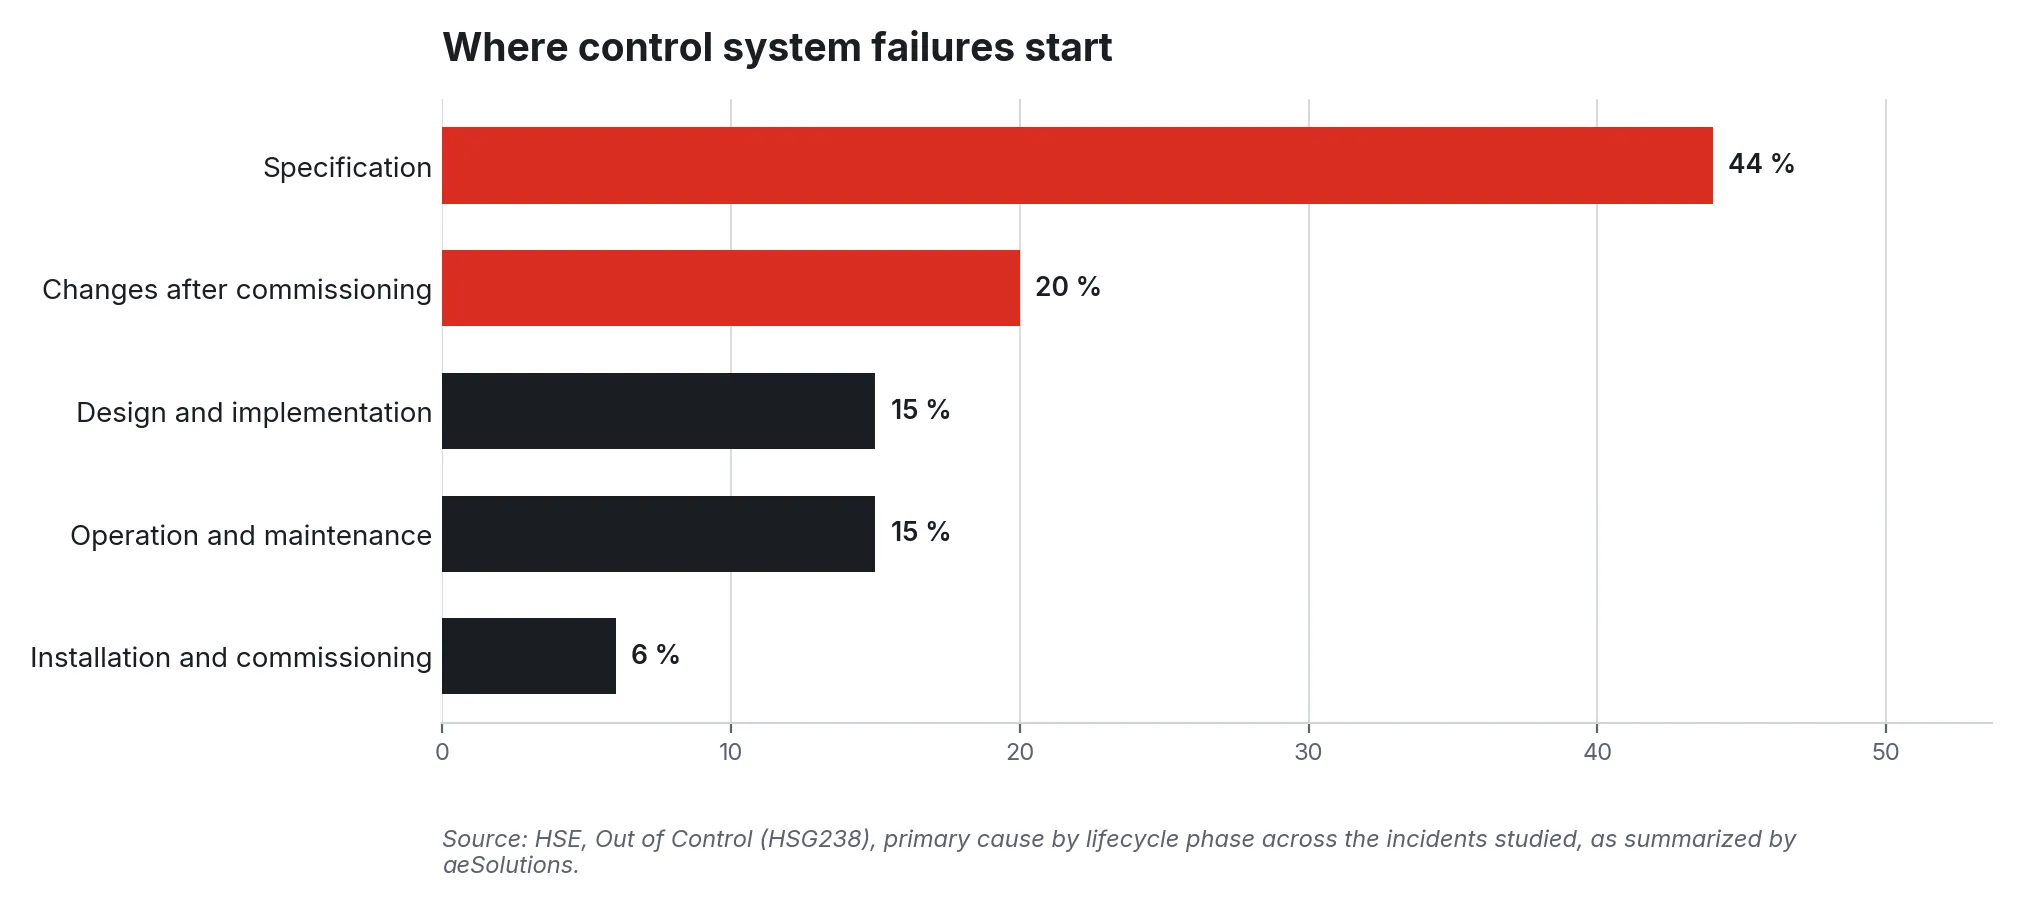
Figure 4. Primary cause of control system failures by lifecycle phase. Source: HSE, Out of Control (HSG238), as summarized by aeSolutions [10].
Security and compliance in the regulators’ terms
None of this makes a plant compliant. The site’s PSM, RMP, and functional safety programs own compliance. What the architecture can do is make the evidence those programs need easier to produce and harder to lose.
OSHA PSM, 29 CFR 1910.119. Paragraph (j)(1) explicitly places controls, including monitoring devices and sensors, alarms and interlocks, and emergency shutdown systems, under mechanical integrity. Paragraph (j)(4)(iv) lists the five documentation elements. Paragraph (j)(5) covers deficiencies. Paragraph (d)(3)(ii) requires documenting that equipment complies with RAGAGEP. Compliance audits come at least every three years under (o), and PHA revalidation at least every five years under (e)(6) [4]. A monitoring layer that keeps test records against equipment IDs, keeps deficiency status, and produces demand and alarm history by unit feeds every one of those.
EPA RMP, 40 CFR Part 68. Around 11,740 facilities had current RMPs when EPA issued the 2024 Safer Communities by Chemical Accident Prevention rule [19]. In February 2026 EPA proposed reversing many of that rule’s provisions [18], so plants should check the current text before relying on any specific amendment.
IEC 61511 / ISA 84. The SIS must stay independent of the BPCS to the degree the risk assessment assumed, and the second edition adds a security risk assessment of the SIS [12]. Clause 16 requires recording demands, faults, and proof test results and comparing actual performance with design [14]. ISA TR84.00.09 covers cybersecurity across the functional safety lifecycle, and current guidance pairs ANSI/ISA-61511 with ISA/IEC 62443 zones and conduits, each assigned a security level [13]. In those terms, the monitoring node is its own zone, and each read-only connection to the gas controller, BPCS, or SIS is a conduit with a documented direction and security level.
ISA-18.2 and EEMUA 191. The alarm management lifecycle runs from philosophy through rationalization, design, implementation, operation, maintenance, monitoring and assessment, management of change, and audit [7]. The monitoring and assessment stage is where this architecture fits: measuring alarm rates, floods, stale alarms, and bad actors against the plant’s alarm philosophy, and feeding the results back to rationalization.
A phased rollout
Figure 5. Phased rollout. Inventory and alarm scoring come first and need no new equipment; the monitoring node, records, and KPIs follow on one unit before extending to others.
1. Weeks 1 to 4: Inventory. Setpoints against exposure limits, SIF proof test status, alarm journal scored. No new hardware.
2. Weeks 4 to 10: Edge node on one unit. Read-only conduits documented for write capability; local historian, event store, and buffering.
3. Months 3 to 6: Records. Tests tied to equipment IDs with the five OSHA elements; open deficiencies visible by age.
4. Months 6 to 12: KPIs. Alarm load and bad actors for operations; demands and long-running bypasses for process safety.
5. Year 2: Other units and sites, including air-gapped ones, with monitoring configuration under management of change.
What to do Monday
Pick the unit with the most toxic inventory. Pull the gas detector configuration out of the controller and put every alarm setpoint next to the exposure limit for the gas it detects. Then ask the board operator to export last month’s alarm journal and count the top ten tags.
Walk the unit and note every detector that is in inhibit, fault, or calibration mode, and every SIS bypass that is active. Write down when each one started.
Then pull the last bump test and calibration record for five detectors and check them against the five OSHA elements. If any of them is missing a name, an equipment ID, or a result, you have found the first thing to fix, and you have not spent anything yet.
About Fireball Industries
Fireball Industries is EmberNet’s master integrator. Its engineers design, build, and support monitoring layers like the one described here for chemical plants, blenders, and toll manufacturers: inventorying detectors and safety functions, building the read-only conduits to gas controllers, DCS platforms, and safety systems, standing up the edge nodes, historians, and records applications, and supporting them through the life of the plant.
Sources
- U.S. Chemical Safety and Hazard Investigation Board, “Toxic Chemical Release at the DuPont La Porte Chemical Facility,” Investigation Report No. 2015-01-I-TX, June 2019. https://www.csb.gov/assets/1/20/dupont_la_porte_final_report_.pdf
- UK Health and Safety Executive, “Offshore: Fire and Explosion Strategy, Fire and Gas Detection,” n.d. https://www.hse.gov.uk/offshore/assets/docs/fireexplosion.pdf
- UK Health and Safety Executive, “Offshore: Fire and Explosion Strategy, Source Terms,” n.d. https://www.hse.gov.uk/offshore/assets/docs/fireexplosion.pdf
- U.S. Occupational Safety and Health Administration, “29 CFR 1910.119, Process safety management of highly hazardous chemicals,” current text. https://www.osha.gov/laws-regs/regulations/standardnumber/1910/1910.119
- U.S. Occupational Safety and Health Administration, “Clarification on the documentation of inspections and tests required under the mechanical integrity provisions,” standard interpretation, September 16, 1996. https://www.osha.gov/laws-regs/standardinterpretations/1996-09-16
- U.S. Occupational Safety and Health Administration, “Calibrating and Testing Direct-Reading Portable Gas Monitors,” Safety and Health Information Bulletin, revised November 26, 2024. https://www.osha.gov/publications/shib093013
- Todd Stauffer, Nicholas P. Sands and Donald G. Dunn, exida, “Alarm Management and ISA-18: A Journey, Not a Destination,” Texas A&M Instrumentation Symposium, 2010. https://www.exida.com/articles/ALARM-MANAGEMENT-AND-ISA-18-A-JOURNEY-NOT-A-DESTINATION.pdf
- ProcessVue, “The Sense and Nonsense of Alarm System Performance KPIs,” v1.0 (citing EEMUA Publication 191), n.d. https://www.processvue.com/downloads/Alarm_system_performance_KPIs_V1_0.pdf
- Rockwell Automation, “Performance Benchmarking and Alarm Philosophy Development,” PROCES-WP014B-EN-P, June 2017. https://literature.rockwellautomation.com/idc/groups/literature/documents/wp/proces-wp014_-en-p.pdf
- aeSolutions, “Is That Really Why Control Systems Go Wrong?” (summarizing HSE, Out of Control, HSG238), n.d. https://www.aesolutions.com/post/is-that-really-why-control-systems-go-wrong-video-presentation
- Federal Bureau of Investigation, “TRITON Malware Remains Threat to Global Critical Infrastructure Industrial Control Systems,” Private Industry Notification / Cybersecurity Advisory, March 25, 2022. https://www.ic3.gov/CSA/2022/220325.pdf
- Hirsch, Gummersbach and Bartsch, “Safety and Security: Is a Physical Separation of the SIS Necessary?”, Chemical Engineering Transactions, Vol. 48, AIDIC, 2016. https://www.aidic.it/cet/16/48/113.pdf
- Renee Bassett, Automation.com, “Established Standards Help Secure the Functional Safety Lifecycle,” October 3, 2025. https://www.automation.com/article/standards-secure-functional-standards-lifecycle
- Steve Gandy, Automation.com, “Complying with IEC 61511 Operation and Maintenance Requirements,” June 7, 2021. https://www.automation.com/article/complying-iec-61511-operation-maintenance
- EHS Today, “CSB on Refinery Blast: Alarms Failed to Alert BP Operators of Dangerous Conditions,” n.d. https://www.ehstoday.com/archive/article/21914025/csb-on-refinery-blast-alarms-failed-to-alert-bp-operators-of-dangerous-conditions
- The Chemical Engineer, “CSB releases final report on hydrogen sulfide release at Texas waterflood station,” June 3, 2021. https://www.thechemicalengineer.com/news/csb-releases-final-report-on-hydrogen-sulfide-release-at-texas-waterflood-station/
- Nick Schmoyer, Inspectioneering, “A Quick Review of Recent OSHA PSM Citations,” January 3, 2019. https://inspectioneering.com/blog/2019-01-03/8177/a-quick-review-of-recent-osha-psm-citations
- U.S. Environmental Protection Agency, “Fact Sheet: Common Sense Approach to Chemical Accident Prevention, Risk Management Program Proposed Rule,” February 24, 2026. https://www.epa.gov/rmp/fact-sheet-common-sense-approach-chemical-accident-prevention-risk-management-program-proposed
- U.S. Environmental Protection Agency, “Accidental Release Prevention Requirements: Risk Management Programs Under the Clean Air Act; Safer Communities by Chemical Accident Prevention,” Federal Register, March 11, 2024. https://www.federalregister.gov/documents/2024/03/11/2024-04458/accidental-release-prevention-requirements-risk-management-programs-under-the-clean-air-act-safer
- International Electrotechnical Commission, “IEC 60079-29-2: Explosive atmospheres, Part 29-2: Gas detectors, Selection, installation, use and maintenance of detectors for flammable gases and oxygen,” 2007 (superseded by 2015 edition). https://webstore.iec.ch/en/publication/644